I Know You're Tired, But Glory Is Just Over Those Hills

I. The Tiredness
"I know you're tired."
A. Wake at 3AM

"The exhaustion you feel isn't weakness. It's the weight of seeing what others refuse to look at."
Three in the morning in a room that smells like cold coffee and the faint electrical burn of a terminal that's been running since yesterday. Charts glowing green against black. The kind of light that makes you look sick if you catch your reflection. Consumer confidence worse than the financial crisis. Manufacturing in full contraction. The kind of readings that historically appear right before everything goes to hell.
Outside, somewhere, America is asleep. Or trying to sleep. In here, the numbers don't sleep. They just accumulate, one data point after another, building a case for collapse that would make a prosecutor weep with joy.
But here's the thing Wall Street won't tell you: the data everyone's watching is the rear-view mirror. Liquidity is the windshield. By the time the recession gets confirmed, liquidity's already turned and you've already missed the trade.
The kind of readings that make you question everything. Whether the old patterns have finally broken. Whether we're watching the end of something or just the beginning dressed up in the same tired apocalypse costume it wears every cycle. The numbers say collapse. The factories dying. Credit cards maxed. Nobody's spending on anything that isn't food or rent. Even the Friday night vices that used to soak up spare twenties are gathering dust. The American consumer, broke enough that even the lowest-rent pleasures are out of reach.
But the money? The money's moving somewhere. In the dark. Where nobody's looking.
I know the exhaustion you're feeling. I feel it too.
Tired of the volatility. The whipsaws that stop you out right before the move. The 20% drawdowns that make you question everything.
Tired of the four-year cycle debates. Is it dead? Is it delayed? Is it even real anymore, or just a pattern we hallucinated from three data points?
Tired of "this time is different." Both the hopium version and the doom version. Tired of narratives that sound brilliant until they blow up in your face.
Tired of being early. Which is just being wrong with better footnotes. Tired of watching the position bleed while the thesis stays intact and every voice in your head screaming you've lost it, lost the edge, lost the plot, lost everything that made you dangerous in the first place.
Tired of the doubt. The voice at 3AM asking if you've lost your edge, lost the plot, lost your mind. The exhaustion that feels like wisdom. The paralysis that feels like prudence.
The sentiment surveys tell us the market is tired too. Manufacturing surveys confirm what you already knew from looking around: the economy's contracting, the factories are dying, nobody's spending. The collective exhaustion of consumers, investors, humans trying to navigate a world that feels like it's coming apart. Can't afford rent, can't afford gas, can't afford the cheap thrills that used to make Friday night worth surviving the week for. Manufacturing dying. Everyone broke and terrified. This isn't just pessimism. It's deep structural stress, crystallized into data points that all say the same thing: sell everything and hide.
Capitulation is a feeling before it's a price. And exhaustion is its cousin.
I've been wrong before. Spectacularly. Expensively. I paid tuition to this market the way Livermore did: in blood and humiliation. The trade that taught me the most cost me the most.
So I'm not here to tell you everything's fine. I'm not here to pump hopium or peddle certainty I don't have.
I'm here to tell you what I see.
And what I see is a divergence. Between what people feel and what the monetary plumbing is actually doing. Between sentiment surveys that read like obituaries and liquidity indicators that are quietly, almost imperceptibly, turning back on.
The fears you won't admit:
- "What if the cycle is dead?"
- "What if I buy and it crashes?"
- "What if I don't buy and it moons?"
- "What if I've already missed it?"
- "What if this time really is different?"
These aren't questions. They're the same fear wearing different masks. The shadow you won't look at directly. The voice that keeps you paralyzed while liquidity builds and ISM confirms the recession you should have bought six months ago.
But glory is just over those hills.
Let me show you.
II. The Hills
"But glory is just over those hills."
The problem with hills is you can't see what's on the other side.
A. The Hills We Face

"The hills know you're tired. They've been waiting for those who are."
Right now, the hills look like this:
The manufacturing collapse. Factories closing. Industrial production in full contraction. The kind of readings that historically appear right before recessions. The old playbook says sell everything.
The consumer capitulation. Sentiment near 2008-crisis levels. Strip club stocks down 80% from peaks (yes, we're tracking strip club stocks against gold to measure consumer confidence, because that's where we are as a civilization). Credit card debt at record highs. Nobody can afford discretionary spending. Everyone feels broke. And when people feel this broke while liquidity expands? That's when fortunes get made.
The uncertainty. What if liquidity doesn't actually recover? What if this is the dead cat bounce before the real crash? What if the legacy indicators are right and the plumbing is lying?
The exhaustion. Four-year cycle fatigue. The voice that says quit, sell everything, never look at another chart. The same exhaustion that marks every bottom in history.
These are real hills. I'm not going to pretend they're not there.
But here's what the hills are hiding.
B. The Divergence
"The gap between what you feel and what is real—that's where the edge lives."
This is the core thesis. The thing the hills are blocking from view.
Sentiment is deeply pessimistic.
- Michigan Consumer Sentiment: 53.6
- Fear & Greed Index: 14 (went as low as 7 on 11/20)
- Everyone agrees it's terrifying
But liquidity is recovering.
- LP 1mo+Risk: +1.98σ (strong short-term signal)
- LP Composite+Risk (12M): -0.53σ (risk filter cautious, up from -13.5 trough)
- LP 3mo+Risk: -1.16σ (cautious medium-term)
- LP 12mo+Risk: -1.15σ (cautious long-term)
- BTC Risk Score: ~27/100 (accumulation zone)
- Short-term positive, composite/longer horizons cautious (classic early-stage divergence)
This is the setup: Bad vibes. Bad data. Good liquidity. Historically, when all three collide? 70% win rate. +28.8% average return at 3 months. That's not hopium. That's pattern recognition from 18 years of data.
Quick translation: The "σ" symbol (sigma) measures how far above or below average. Positive (+) means above average, negative (-) means below average. "+1.98σ" means liquidity is much higher than normal. Think of it like a thermometer: positive = expanding, negative = contracting. The bigger the number, the stronger the signal.
And price remains elevated despite the fear.
- Bitcoin: $86,000 (Note: BTC price is highly volatile and may differ at publication, but underlying probabilities remain consistent)
- With a Fear Index of 16
Read that again. Bitcoin at $86k with extreme fear. Not extreme greed. Not euphoria. Fear.
This is the gap. Between what people feel and what the system is doing.
Historical pattern: Extreme sentiment lows mark inflection points. Not tops. Bottoms.
When consumer sentiment hits these levels, one of two things happens:
- The economy follows sentiment into the abyss (2008-style)
- Sentiment diverges from reality and mean-reverts violently upward (contrarian paradise)
The tell is always the same: liquidity. If the monetary system is seizing up, sentiment is a leading indicator. If liquidity is flowing despite the fear, sentiment is noise.
Right now, liquidity is flowing.
That's what's on the other side of the hills.
The crowd's too exhausted to climb. They're still nursing wounds from the last cliff they fell off, still convinced the game is rigged, still waiting for someone to tell them it's safe. Nobody's coming to tell you it's safe. Markets don't wait for consensus. They reward the savage few who move when everyone else is paralyzed by the obvious.
This is that moment. Not when CNBC gives you permission. Not when your uncle finally admits Bitcoin isn't a scam. When the data screams one direction and your gut screams the opposite and you're the only one insane enough to trust the plumbing over the headlines.
III. The Terrain
Mapping the landscape between here and glory
Before you climb, you need to know the terrain. Here's what the charts show.
A. The Engine Room
"The machine doesn't ask permission. It just runs on fuel nobody's watching."
The engine doesn't negotiate. It doesn't care about your feelings, your portfolio's pain threshold, or whether Jim Cramer gave you permission. It runs on four models measuring one thing: is money flowing into the system or isn't it?
Retail obsesses over chart patterns, Fibonacci retracements, head-and-shoulders—technical tea leaves that tell you nothing about whether the system has fuel. Meanwhile, the professionals watch repo rates, M2 growth, balance sheets, funding spreads. The boring stuff. The plumbing. Because plumbing determines whether capital flows into risk assets or gets trapped in the system's circulatory system.
The signal doesn't negotiate. It doesn't explain itself on cable news or wait for your emotional readiness. It just measures: is the fuel flowing or isn't it? Right now, LP_1mo says yes. The short-term tank is filling at +1.98σ—nearly two standard deviations above neutral. That's not noise. That's not a maybe. That's the engine warming up while everyone else argues about whether it's broken.
The professionals don't wait for certainty. Certainty is expensive. By the time everyone agrees the bull market is back, the alpha is gone. You're buying what smart money already owns. The divergence—short-term positive, longer horizons cautious—is the uncomfortable zone where asymmetric returns live. Not comfortable. Profitable.
Liquidity is the engine of the market. Everything else is just noise on the deck.
You can have the best technical setup, the most bullish fundamentals, the perfect four-year cycle timing. None of it matters if liquidity isn't flowing. Assets don't move because they "should." They move because there's money available to buy them. When central banks expand balance sheets, when repo markets unfreeze, when M2 grows, when credit conditions ease, that's when risk assets catch a bid. Not because sentiment improved. Because the plumbing works again.
The Liquidity Pulse models track this engine in real time. They don't care about narratives. They measure whether capital is expanding or contracting across the system. Right now, the short-term model (LP_1mo) is strongly positive at +1.98σ. That's not hopium. That's the engine turning back on.
Here's what most retail traders miss: they obsess over chart patterns, Fibonacci retracements, head-and-shoulders formations—technical tea leaves that tell you nothing about whether the system has fuel to move higher. Meanwhile, the professionals are watching repo rates, M2 growth, commercial bank balance sheets, and wholesale funding spreads. The boring stuff. The plumbing. Because the plumbing determines whether capital flows into risk assets or gets trapped in the financial system's circulatory system.
When the liquidity engine turns positive, it doesn't matter if sentiment is in the gutter or if everyone's screaming about recession. Assets move because money is available to buy them. Period. The short-term model at +1.98σ means the fuel gauge is filling rapidly. Not "maybe filling" or "might fill soon." Filling now. While everyone's watching CNBC for permission to buy, the liquidity models are telling you the engine's already running. The question isn't whether to pay attention to this signal. The question is whether you trust boring data over exciting narratives.
The Liquidity Engine: Global Money Supply in Motion
My primary model is the Global Liquidity Pulse, a composite that tracks the rate of change in monetary supply available for financial assets. It combines:
- Broad Money Supply & Credit: M2, bank credit, commercial loans. Slow-moving but foundational.
- Wholesale Funding & Central Bank Operations: Repo/reverse-repo usage, balance sheet deltas, funding spreads (SOFR-EFFR). The real-time health of the plumbing.
The Four Models:
- LP_1mo (1-Month Lead): Optimized for 30-day forward prediction. Current: +1.98σ
- LP_3mo (3-Month Lead): Optimized for 90-day forward (Granger F~9.8). Current: -1.29σ
- LP_12mo (12-Month Lead): Optimized for 360-day forward prediction. Current: -1.20σ
- LP_Composite: Weighted blend (50% 1mo + 30% 3mo + 20% 12mo). Current: +0.32σ
LP_1mo strongly positive, composite positive, longer horizons cautious. Classic early-stage divergence: short-term liquidity leads while macro caution persists. The signal is building.
Early signals are never trusted. That's what makes them valuable. By the time consensus forms around a thesis, the asymmetric entry is gone—you're buying the top of page six in the Wall Street Journal, not the bottom that forms in the data when nobody's watching. The liquidity models turned positive in September while the Fear Index was printing single digits. That's not a coincidence. That's the setup.
The professionals aren't on CNBC explaining why they're buying. They're quietly accumulating while retail is still traumatized from the last drawdown, still Googling "is Bitcoin dead again," still waiting for Jim Cramer to give them permission. The signal doesn't wait for permission. It just builds, one repo operation at a time, one M2 data point at a time, one funding spread normalization at a time—boring, technical, unsexy. The kind of plumbing that doesn't make headlines until six months later when prices have already ripped and everyone's wondering how they missed it.
This is why liquidity models outperform sentiment indicators over time. Sentiment is reactive—it tells you how people feel about what already happened. Liquidity is predictive—it tells you what's about to happen before anyone notices. LP_1mo at +1.98σ means the short-term fuel gauge is filling up. It doesn't care that Michigan consumers are depressed or that the Fear Index hit 7. It just measures whether money is flowing into the system. And right now, it is.
The divergence between short-term positive and medium/long-term cautious (LP_3mo at -1.29σ, LP_12mo at -1.20σ) creates the classic early-stage setup. It's uncomfortable because the models don't all agree yet. If all four were screaming positive, you'd already be late—the easy money would be gone and the risk-reward compressed. But when short-term leads while longer horizons lag, you're in the window where informed capital positions before the crowd realizes what's happening. That window is measured in weeks, not months.
Reading the Signal Divergence:
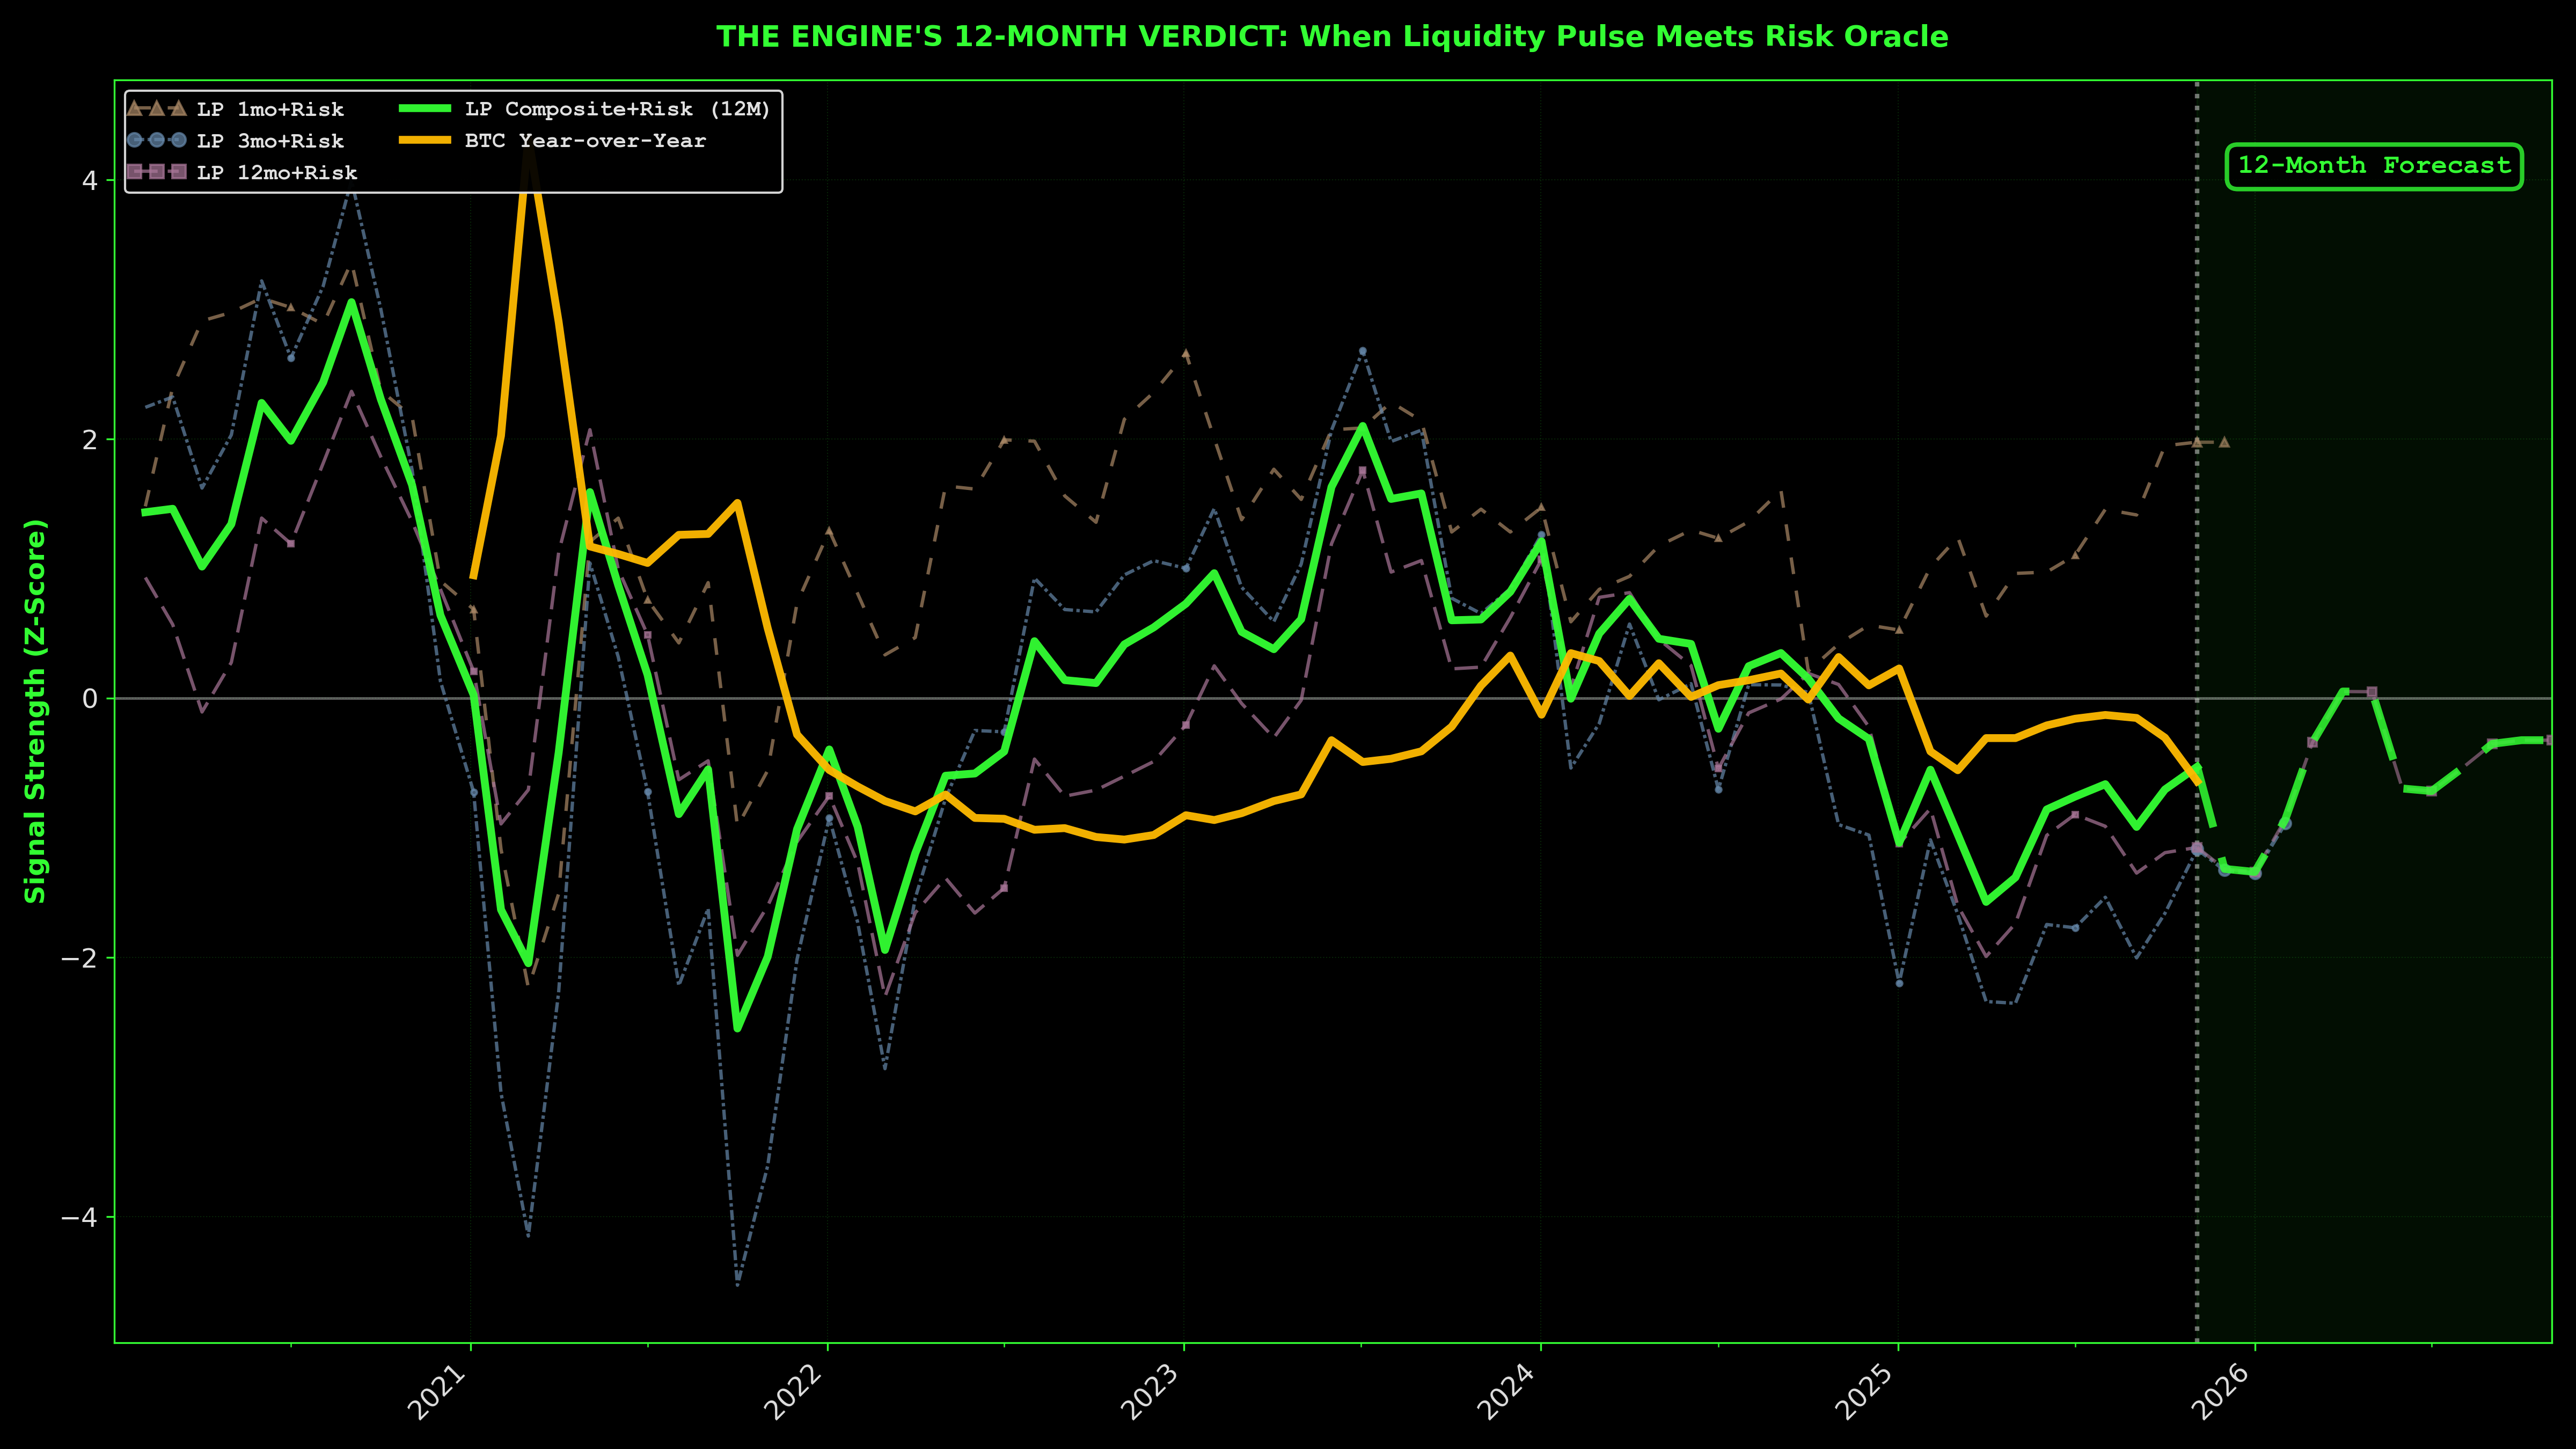
The chart above shows the LP Composite+Risk signal (bright green line, risk-filtered for trading) alongside BTC's year-over-year performance (amber line) from 2020 forward, with 12-month projections. Note the component models (1mo, 3mo, 12mo Risk) displayed as muted dashed lines. These feed into the composite signal.
Two Views of Liquidity:
The raw LP_Composite (unfiltered) shows short-term recovery:
- September 2025: +0.50σ (positive)
- October 2025: +0.67σ (expanding)
- Nov 2025: +0.32σ (still positive, slight pullback)
- December 2025 (projected): +0.24σ (mild expansion)
But the risk-filtered Composite_Risk_12M (what Chart 0 displays in bright green) shows continued caution:
- September 2025: -1.35σ (risk filter negative)
- October 2025: -1.19σ (slight improvement)
- Nov 2025: -1.15σ (continued caution)
- December 2025 (projected): -1.32σ (risk filter still restrictive)
- April 2026 (projected): +0.05σ (risk filter finally clears)
This is the divergence: the raw liquidity signal is turning positive, but the risk overlay remains cautious. The system is warming up, but the risk filter won't give the all-clear until Q2 2026. That's the edge. Knowing liquidity is building even when risk metrics lag.
The raw signal turned positive in September while the Fear Index printed single digits. That's not coincidence. That's the setup. Early signals are never trusted—that's what makes them valuable. By the time consensus forms, the asymmetric entry is gone. You're buying page six of the Wall Street Journal, not the bottom forming in data nobody watches.
The professionals aren't on CNBC explaining why they're buying. They're quietly accumulating while retail Googles "is Bitcoin dead again" and waits for Cramer's permission. The signal doesn't wait. It builds—repo operation by repo operation, M2 data point by M2 data point—boring, technical, unsexy plumbing that doesn't make headlines until six months later when everyone wonders how they missed it.
⚠️ Forecast Caution: Long-term projections deserve skepticism. Geopolitical shocks, fiscal whiplash, macro regime shifts can trash any model past 3-6 months. The longer-term metrics are negative but represent improvement from trough—not deterioration. The edge is in short-term leads while longer horizons lag.
Liquidity is the engine. Sentiment is the exhaust.
Everyone's watching the smoke. The professionals watch the fuel gauge. The engine doesn't care if you're scared. It doesn't care if Michigan consumers feel like jumping off a bridge. It runs on money supply, credit conditions, wholesale funding spreads—the stuff nobody discusses at dinner parties because it's too boring to be wrong about.
The models aren't prophets. They're probabilistic machines trained on historical relationships that can break. But here's the thing about uncertainty: everyone shares it. The question isn't whether you have perfect information—nobody does. The question is whether you're positioned for the base case or paralyzed waiting for the impossible guarantee. Short-term liquidity is positive. Sentiment is capitulating. The crowd is doing the opposite of what the data suggests. That's the setup.
Historical Sentiment Context
While the plumbing warms up, the crowd's already dead. Not dying—dead. Check the readings:
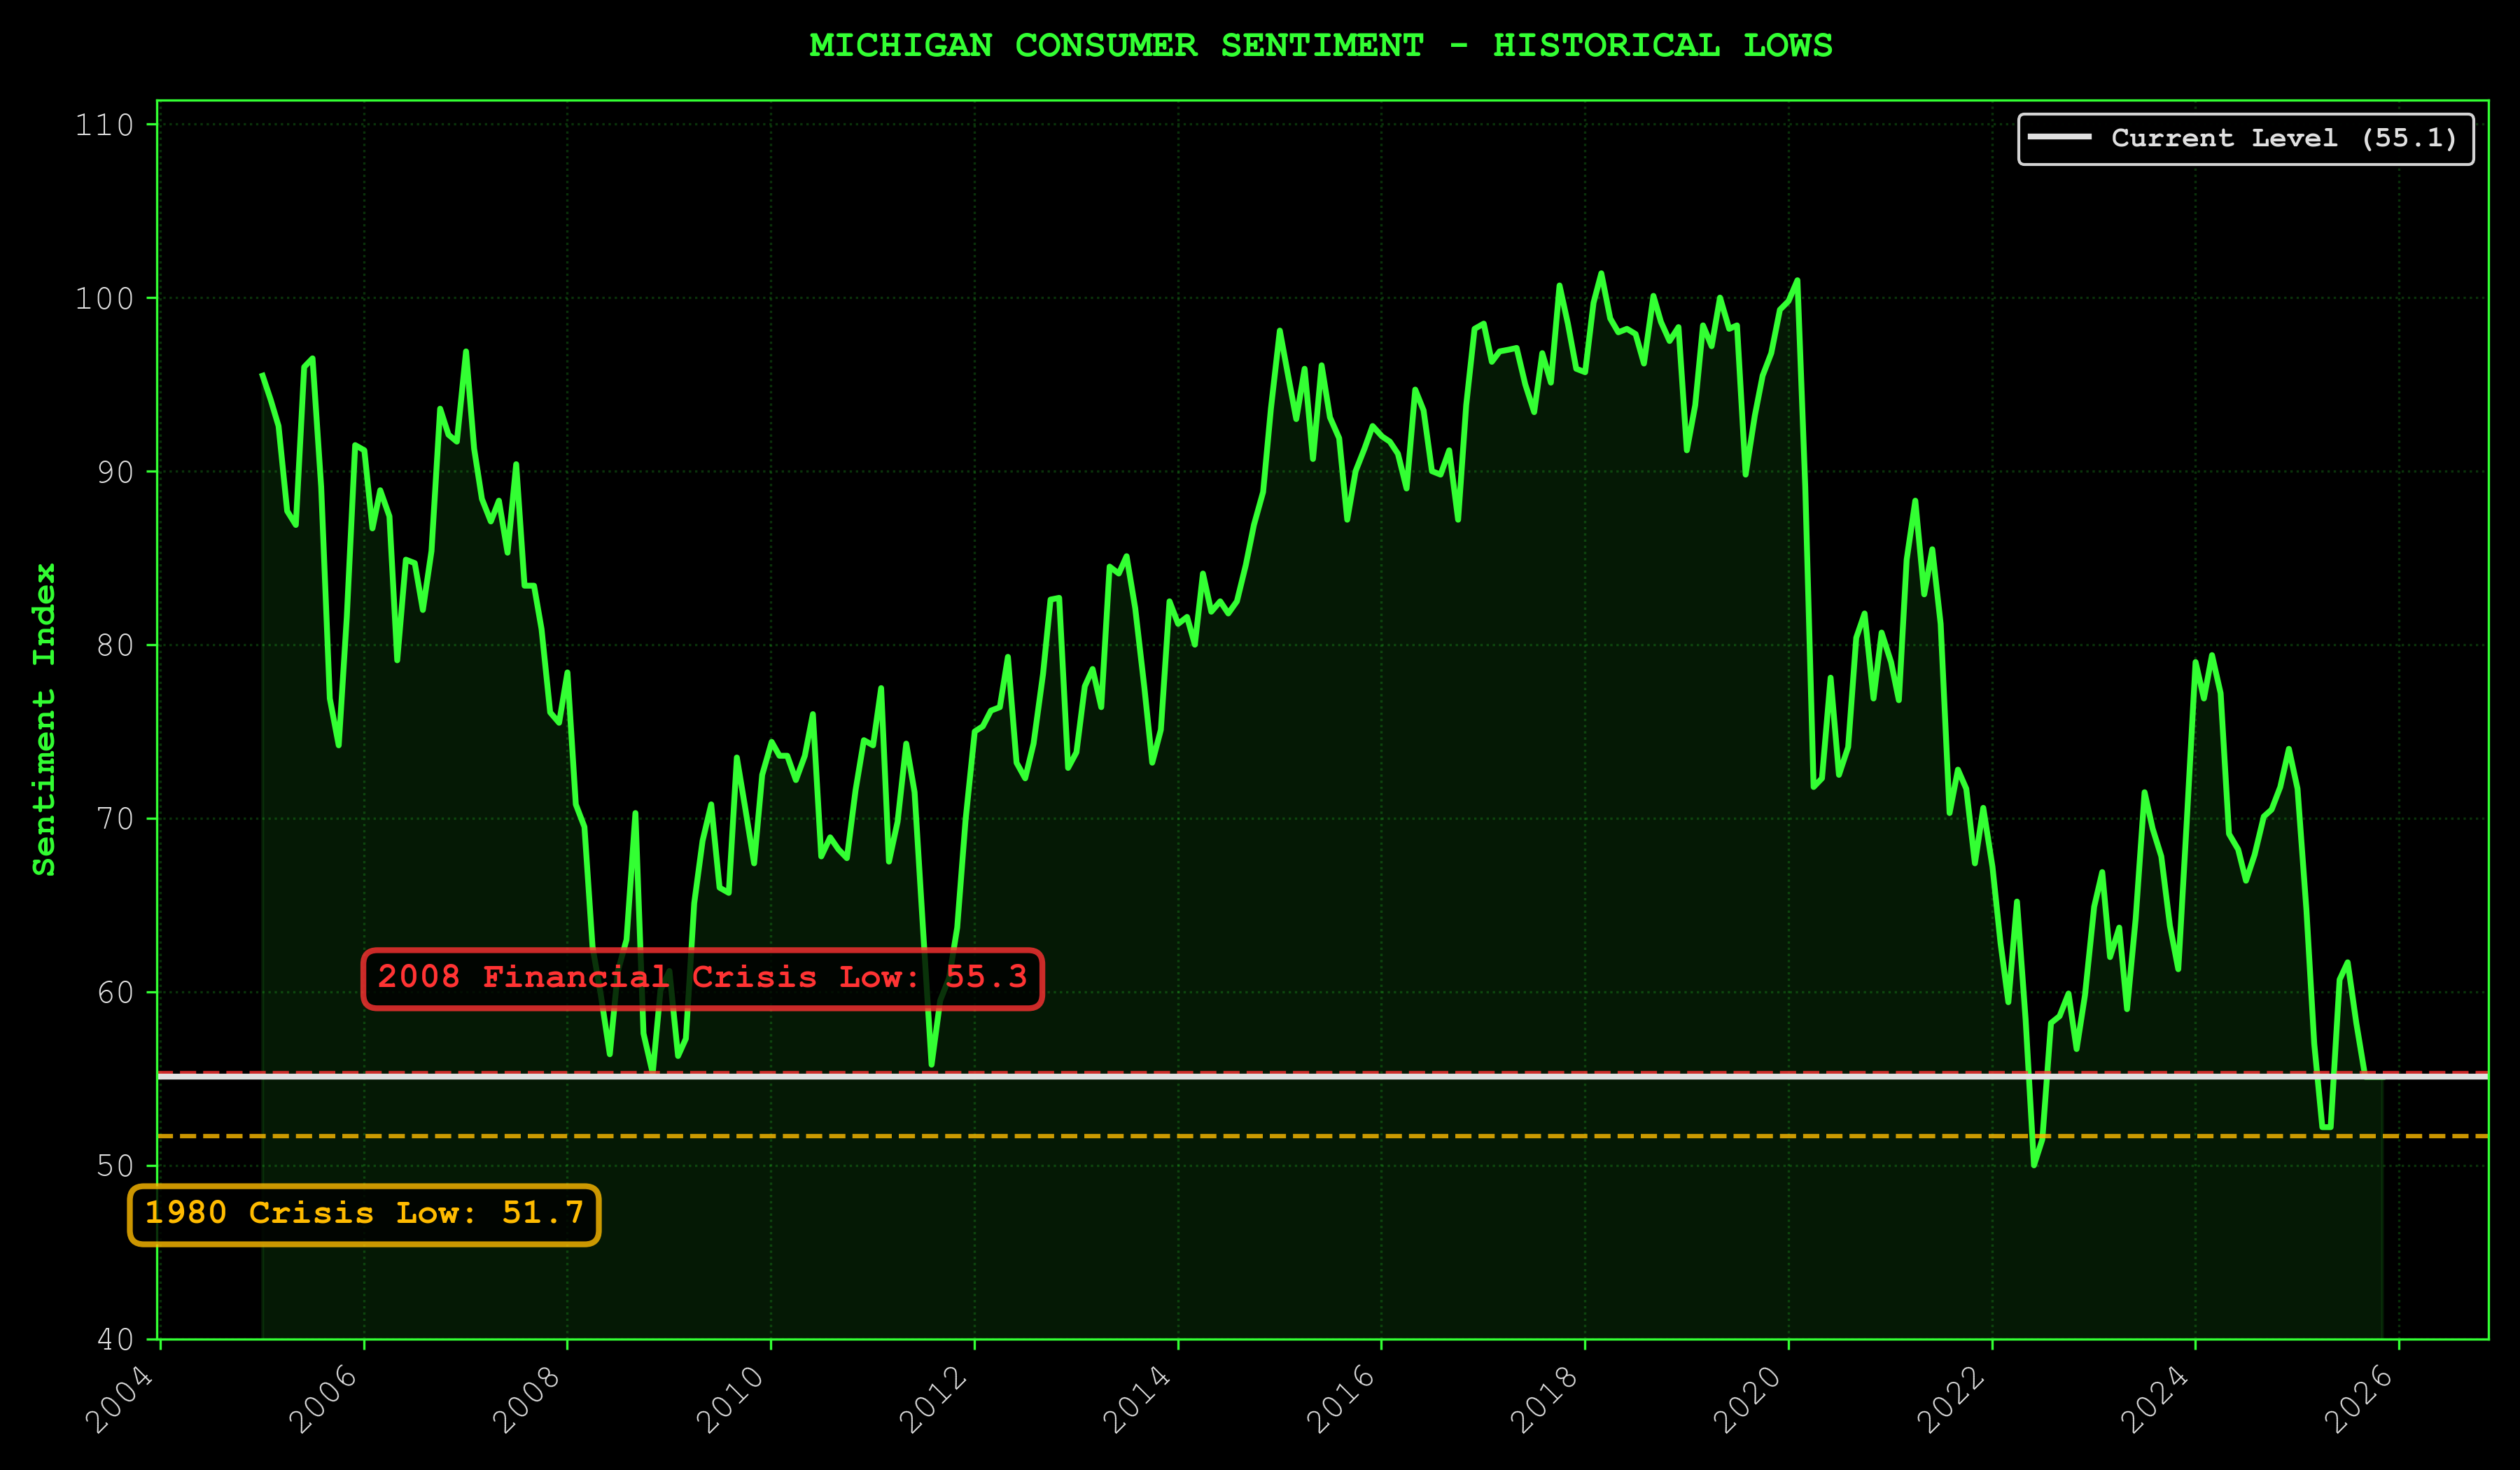
This isn't garden-variety pessimism. This is generational exhaustion crystallized into data. Worse than 2008. Worse than COVID. Approaching 1980 Volcker territory. The crowd is capitulating. That's your signal. Yet liquidity flows. The tank's filling while everyone stares at the rearview mirror screaming about sentiment hitting crisis levels.
B. The Wall of Worry
"The wall isn't there to stop you. It's there to stop those who don't want it enough."
Markets climb walls of worry. They slide down slopes of hope.
This is a wall.
Bitcoin Risk Score: BTC/Gold Accumulation Gauge
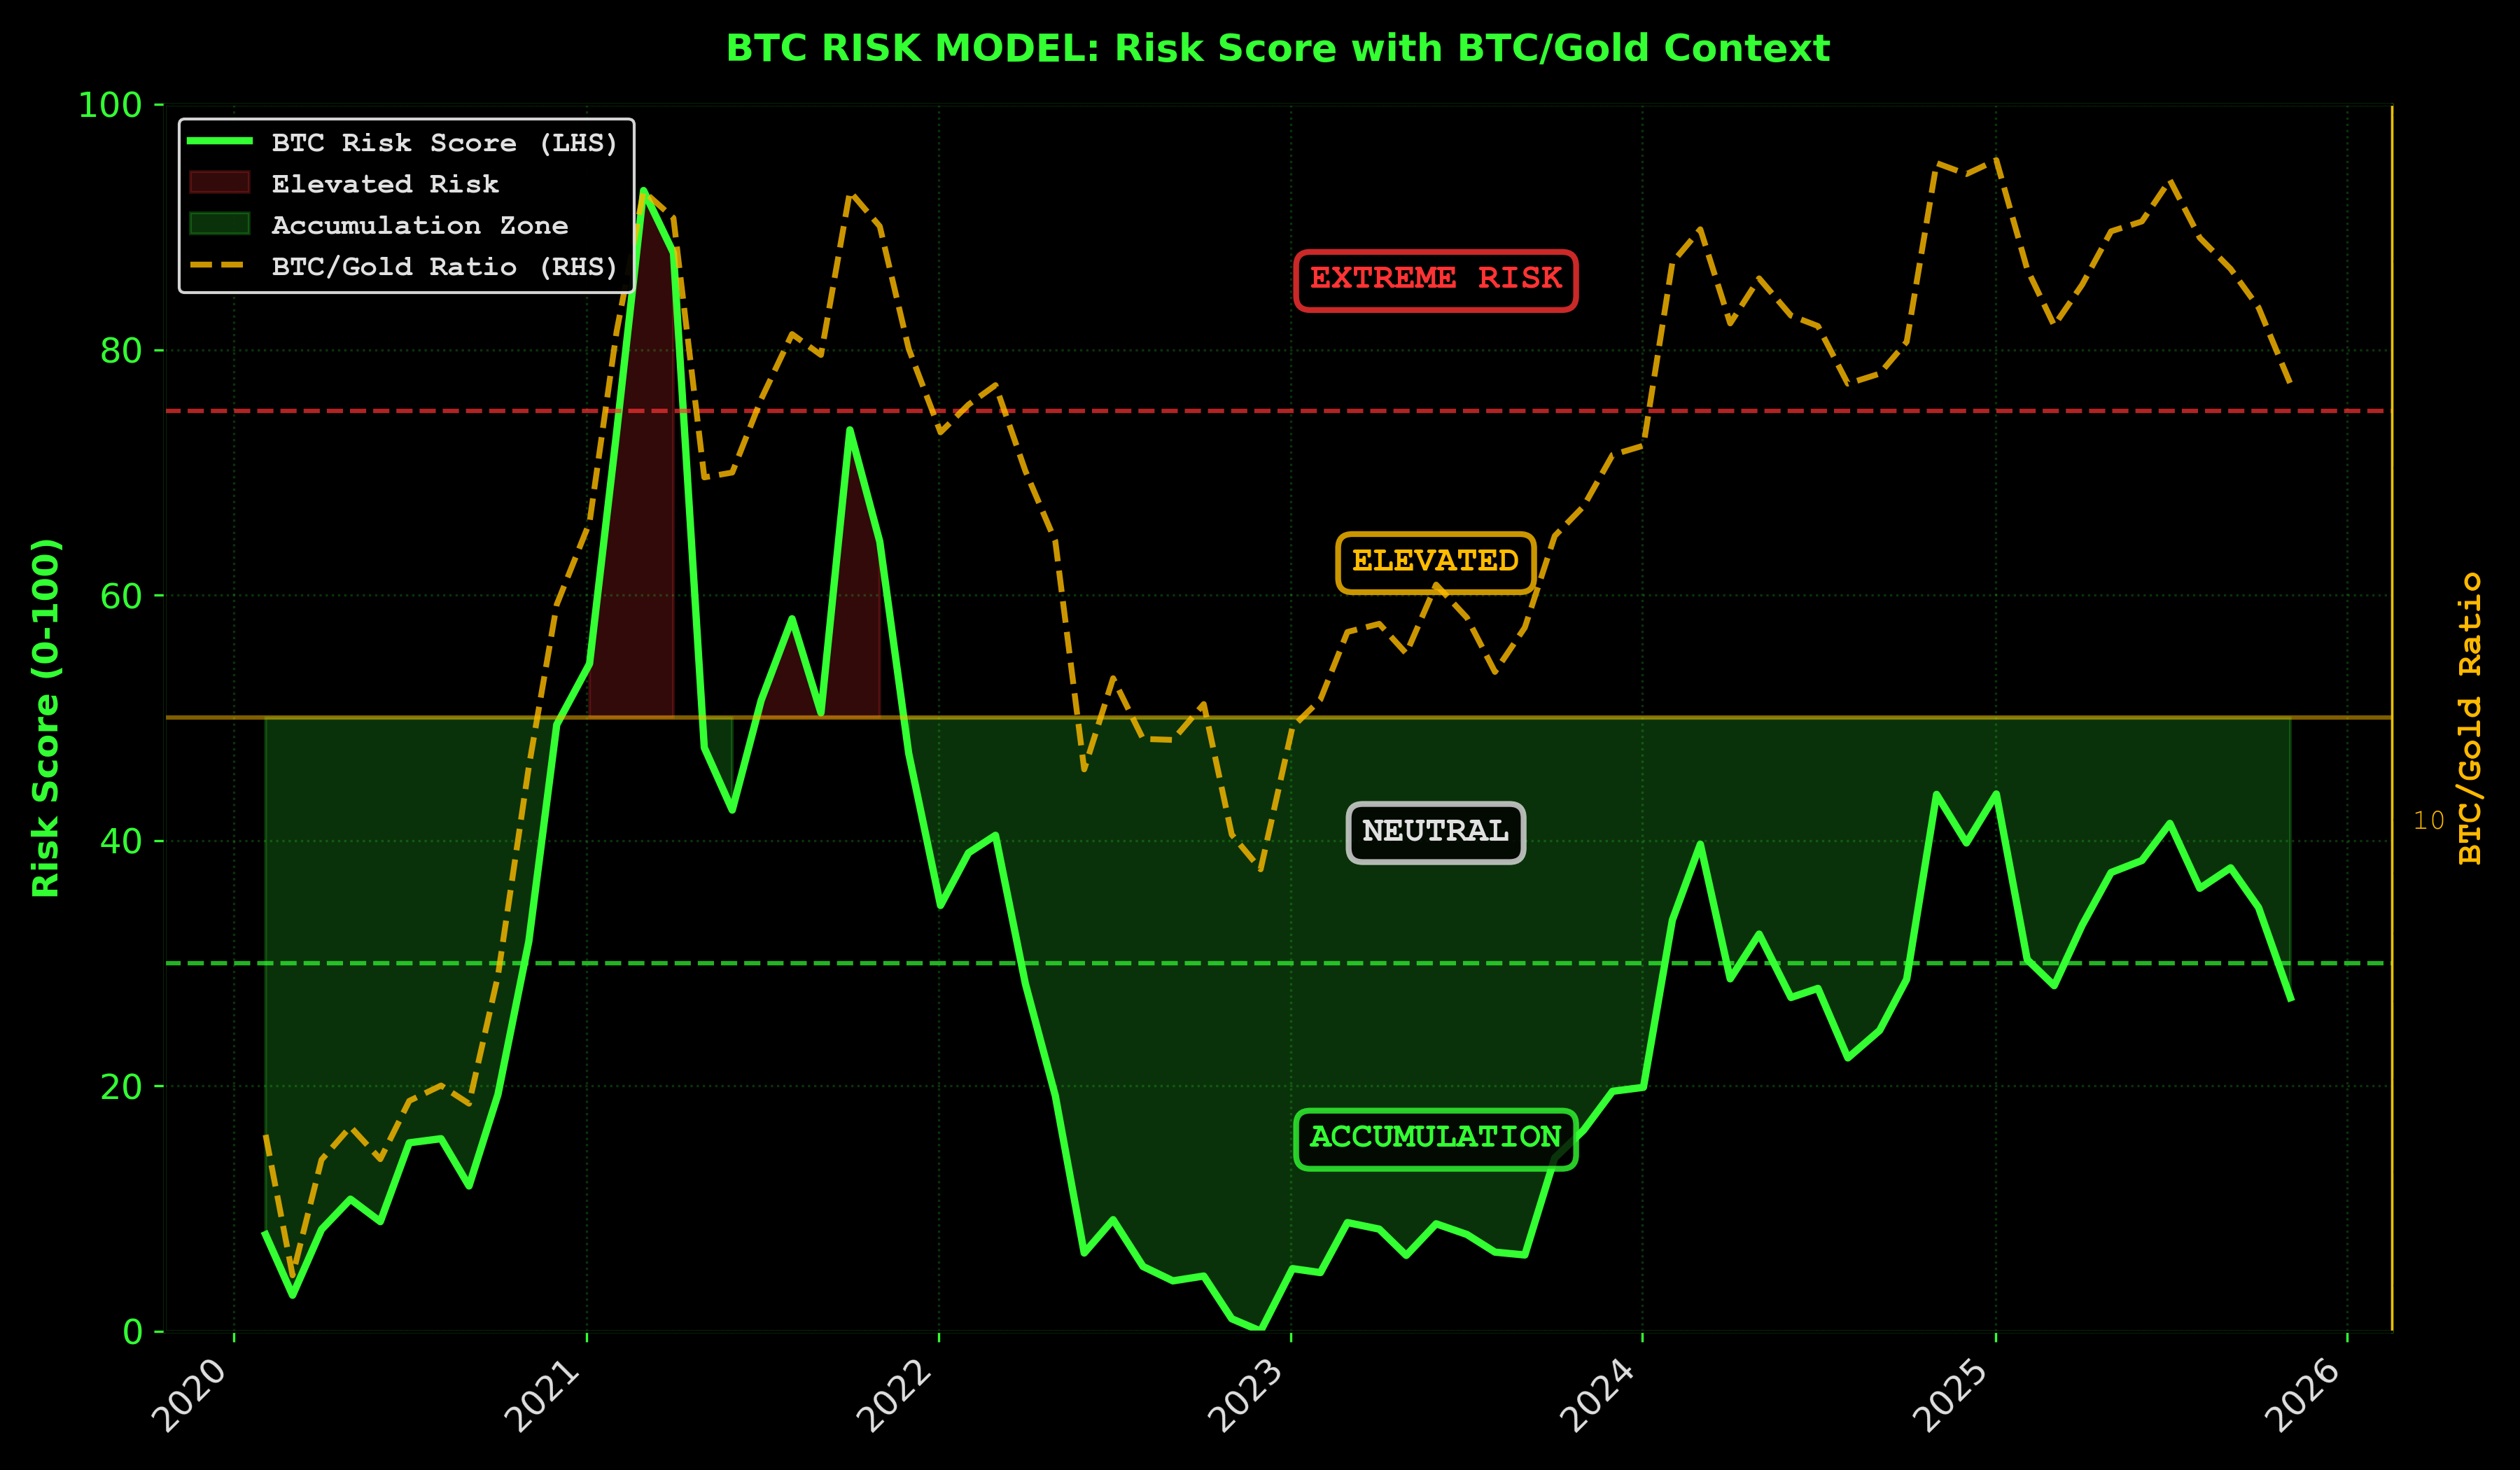
Dollar drawdown from all-time highs is a noisy metric—it tells you distance from peak price but ignores purchasing power erosion, monetary debasement, and the broader macro context. A better risk gauge: BTC priced in gold.
Why BTC/Gold matters more than BTC/USD drawdown:
Gold is the oldest monetary benchmark—it strips out fiat currency distortion. When BTC rises against gold, it's gaining real purchasing power, not just nominal dollar gains that evaporate with inflation. Measuring risk through BTC/gold shows whether you're accumulating actual wealth or chasing a number.
Current BTC Risk Score: ~27/100 (strong accumulation zone)
Note: BTC price at $86,000 as of analysis. Given BTC's high volatility, price may be materially higher or lower at publication. However, the underlying risk model probabilities remain structurally consistent—a 10-15% price swing doesn't fundamentally alter whether we're in accumulation, distribution, or euphoria territory. As price falls, risk score improves (lower = better entry); as price rises, risk score increases but the composite LP+Risk model accounts for both scenarios.
The risk model strips away the bullshit and measures three things:
- Power law deviation: How far Bitcoin's strayed from its fundamental growth curve. Translation: are you buying a bubble or a bargain?
- MVRV Z-score: The gap between what holders paid for their coins and what the market says they're worth. When hope collapses to reality, that's your entry.
- RSI momentum regime: Is the crowd panicking (good for you) or chasing (bad for you)? Oversold + low risk = accumulation zone. Overbought + high risk = distribution trap.
Measure wealth in gold, not headlines. The crowd sees drawdown. The model sees discount.
BTC/Gold Ratio Context:
At current levels ($86k), BTC is trading at a historically reasonable multiple to gold—not the euphoric peaks of cycle tops, not the capitulation depths of bear bottoms. This middle ground, combined with extreme fear, creates the classic risk-reward asymmetry.
Risk Timeline: Bitcoin's Power Law Journey
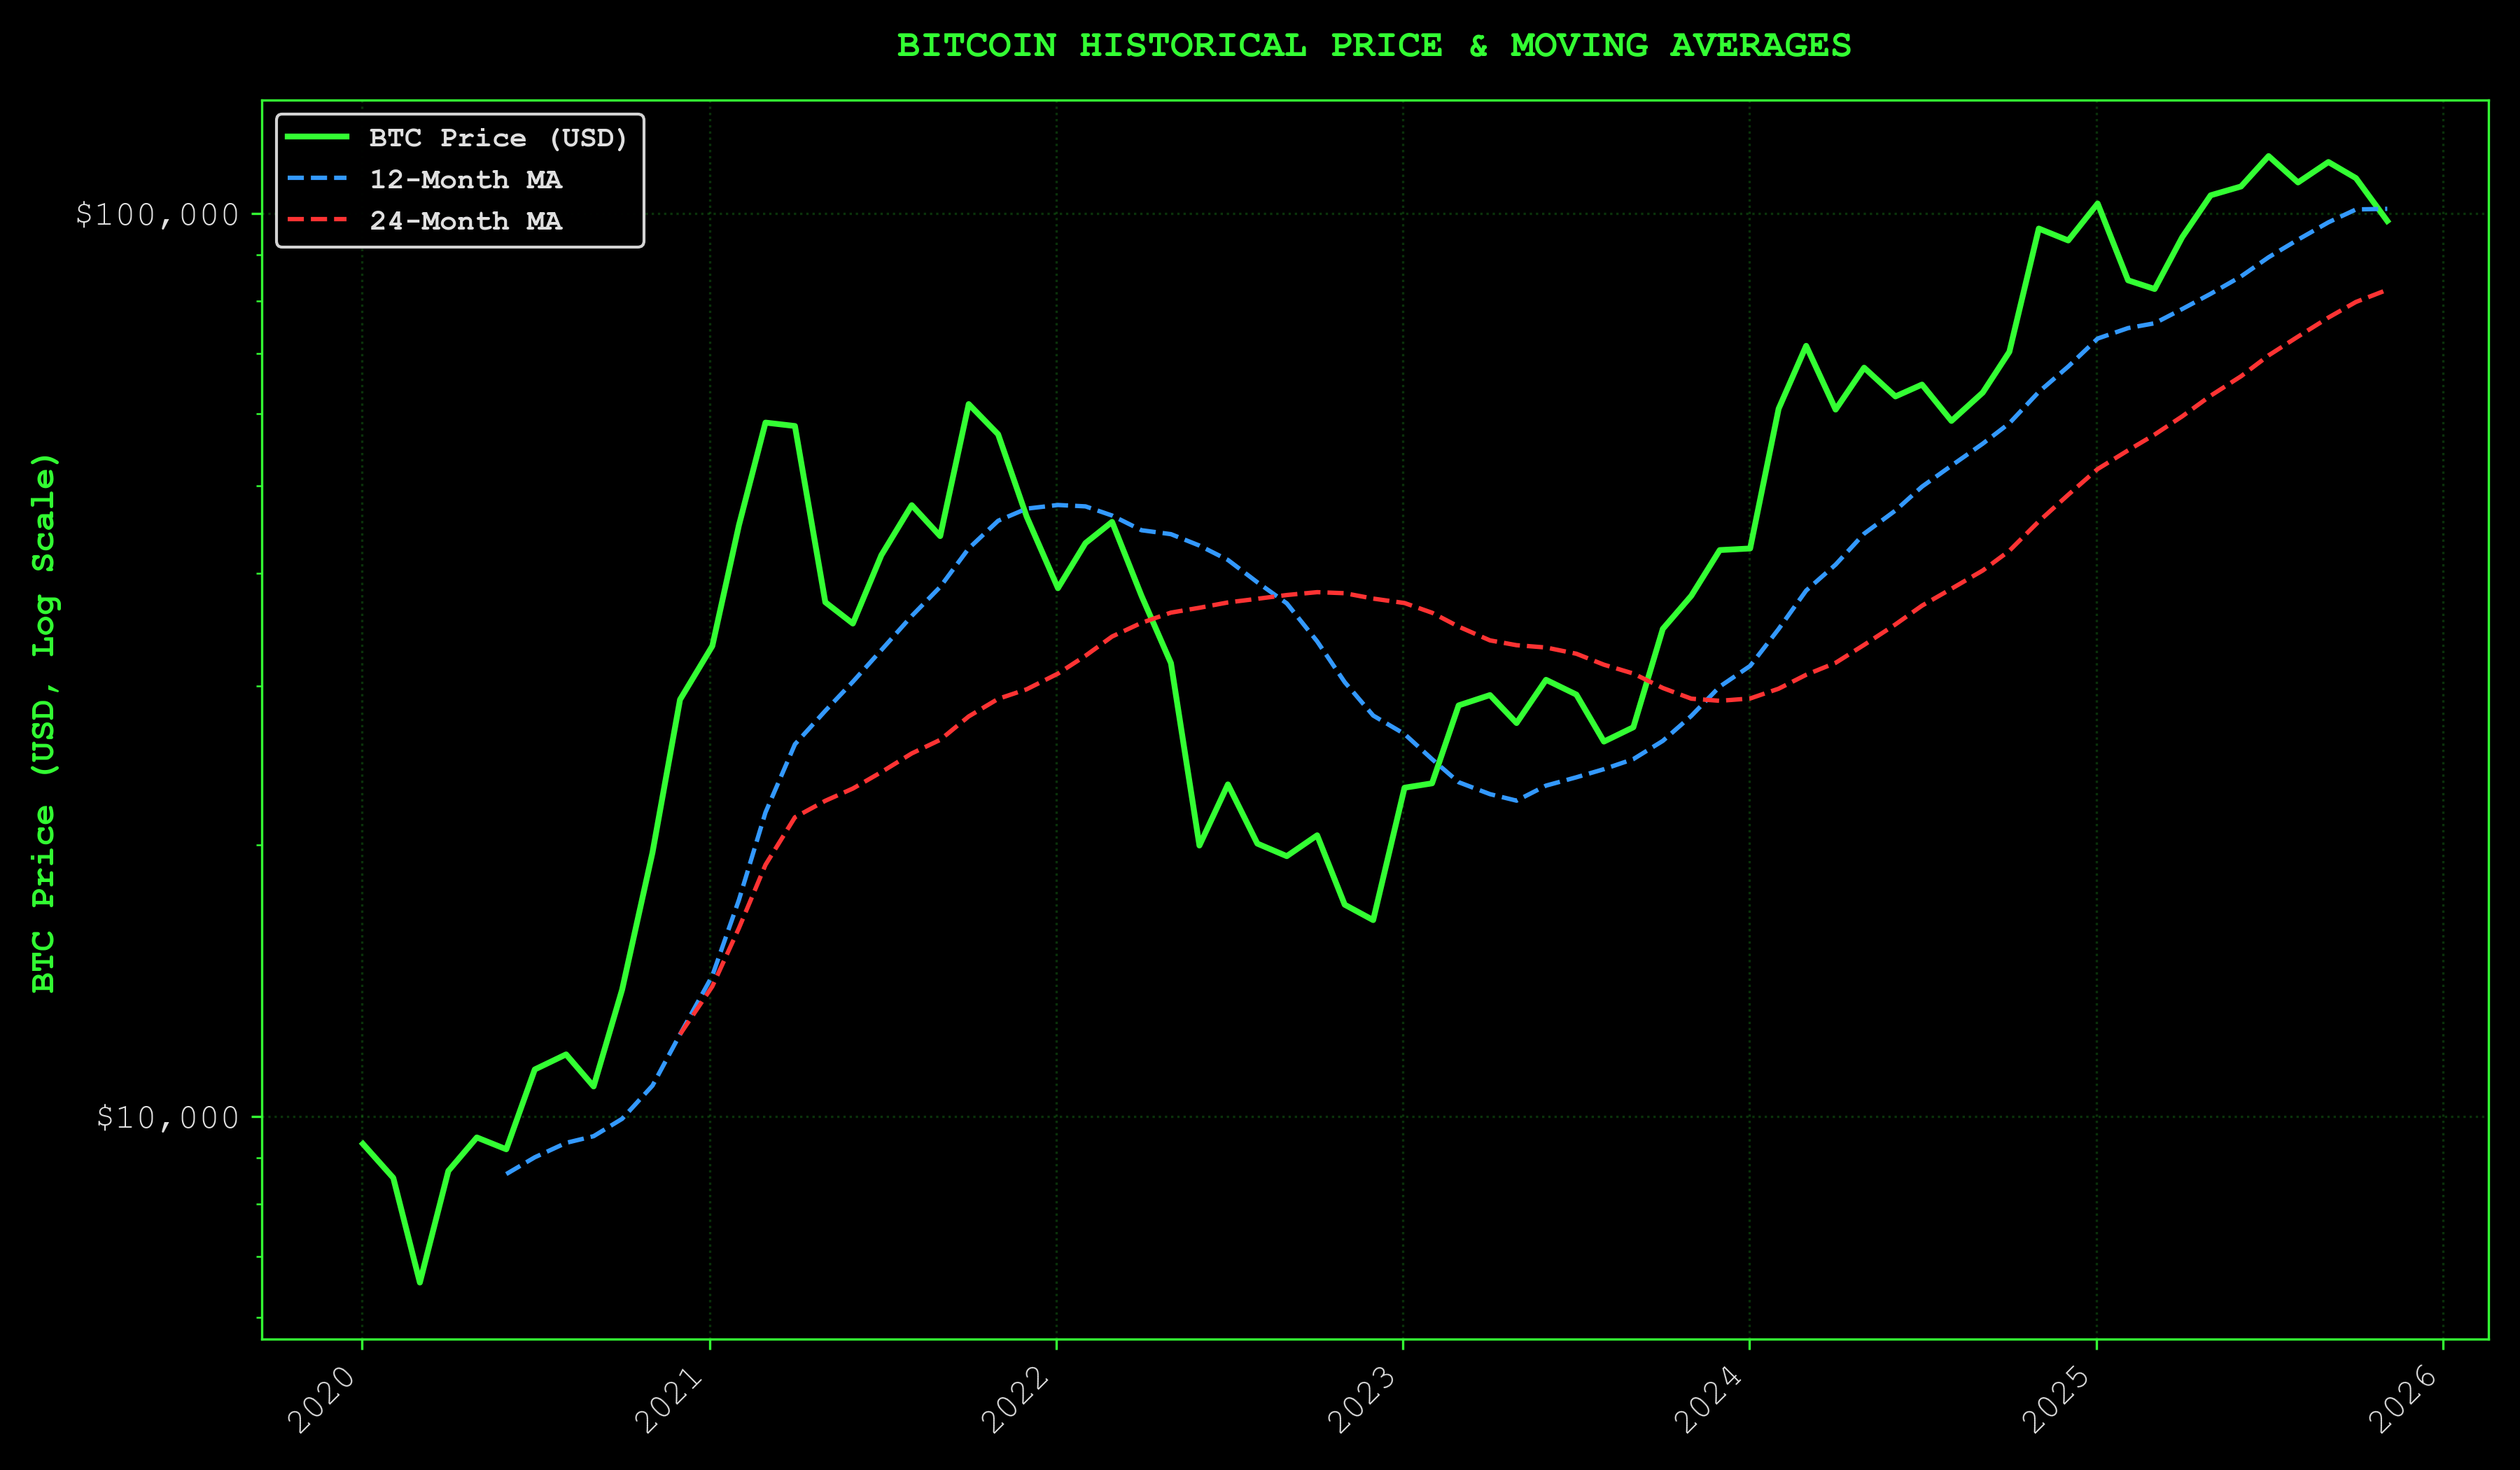
The Core Insight
Dollar drawdown from all-time highs is a noisy metric—it measures distance from peak price but ignores purchasing power erosion, monetary debasement, and macro context. When you measure Bitcoin's dollar price against a currency that's constantly losing value, you're measuring against a moving target.
BTC/gold strips away the fiat illusion and shows you what's real.
Current Setup
Risk Score: ~27/100 (strong accumulation zone) Fear Index: 14 (extreme fear) BTC/gold ratio: neutral territory
What This Means
At ~27/100 risk score with extreme fear, the model says strong accumulation zone—not euphoria, not despair.
The lower the price goes from here, the more attractive the risk-adjusted entry becomes.
The Psychology of Accumulation
Accumulation zones feel like mistakes. That's their defining characteristic.
You're buying when every voice in your head—and every talking head on TV—is screaming you're catching a falling knife. The Fear Index at 14 isn't a bug. It's confirmation.
When risk assets are in accumulation territory while sentiment is in the gutter, one of two things is happening: the market is broken and heading lower, or you're being offered the setup that only comes a few times per cycle.
Why BTC/Gold Matters
The BTC/gold ratio reveals whether you're accumulating actual wealth or chasing nominal gains that evaporate to inflation.
- Rising: building real purchasing power
- Falling: losing ground to the oldest monetary benchmark
- Current: neutral territory—not bubble, not capitulation, just accumulation
We're in the zone where patient capital gets rewarded and weak hands capitulate to strong hands.
Traders don't win by buying after everyone agrees it's safe. They win by buying when it feels dangerous but the models say otherwise.
This is that zone.
Market Stress
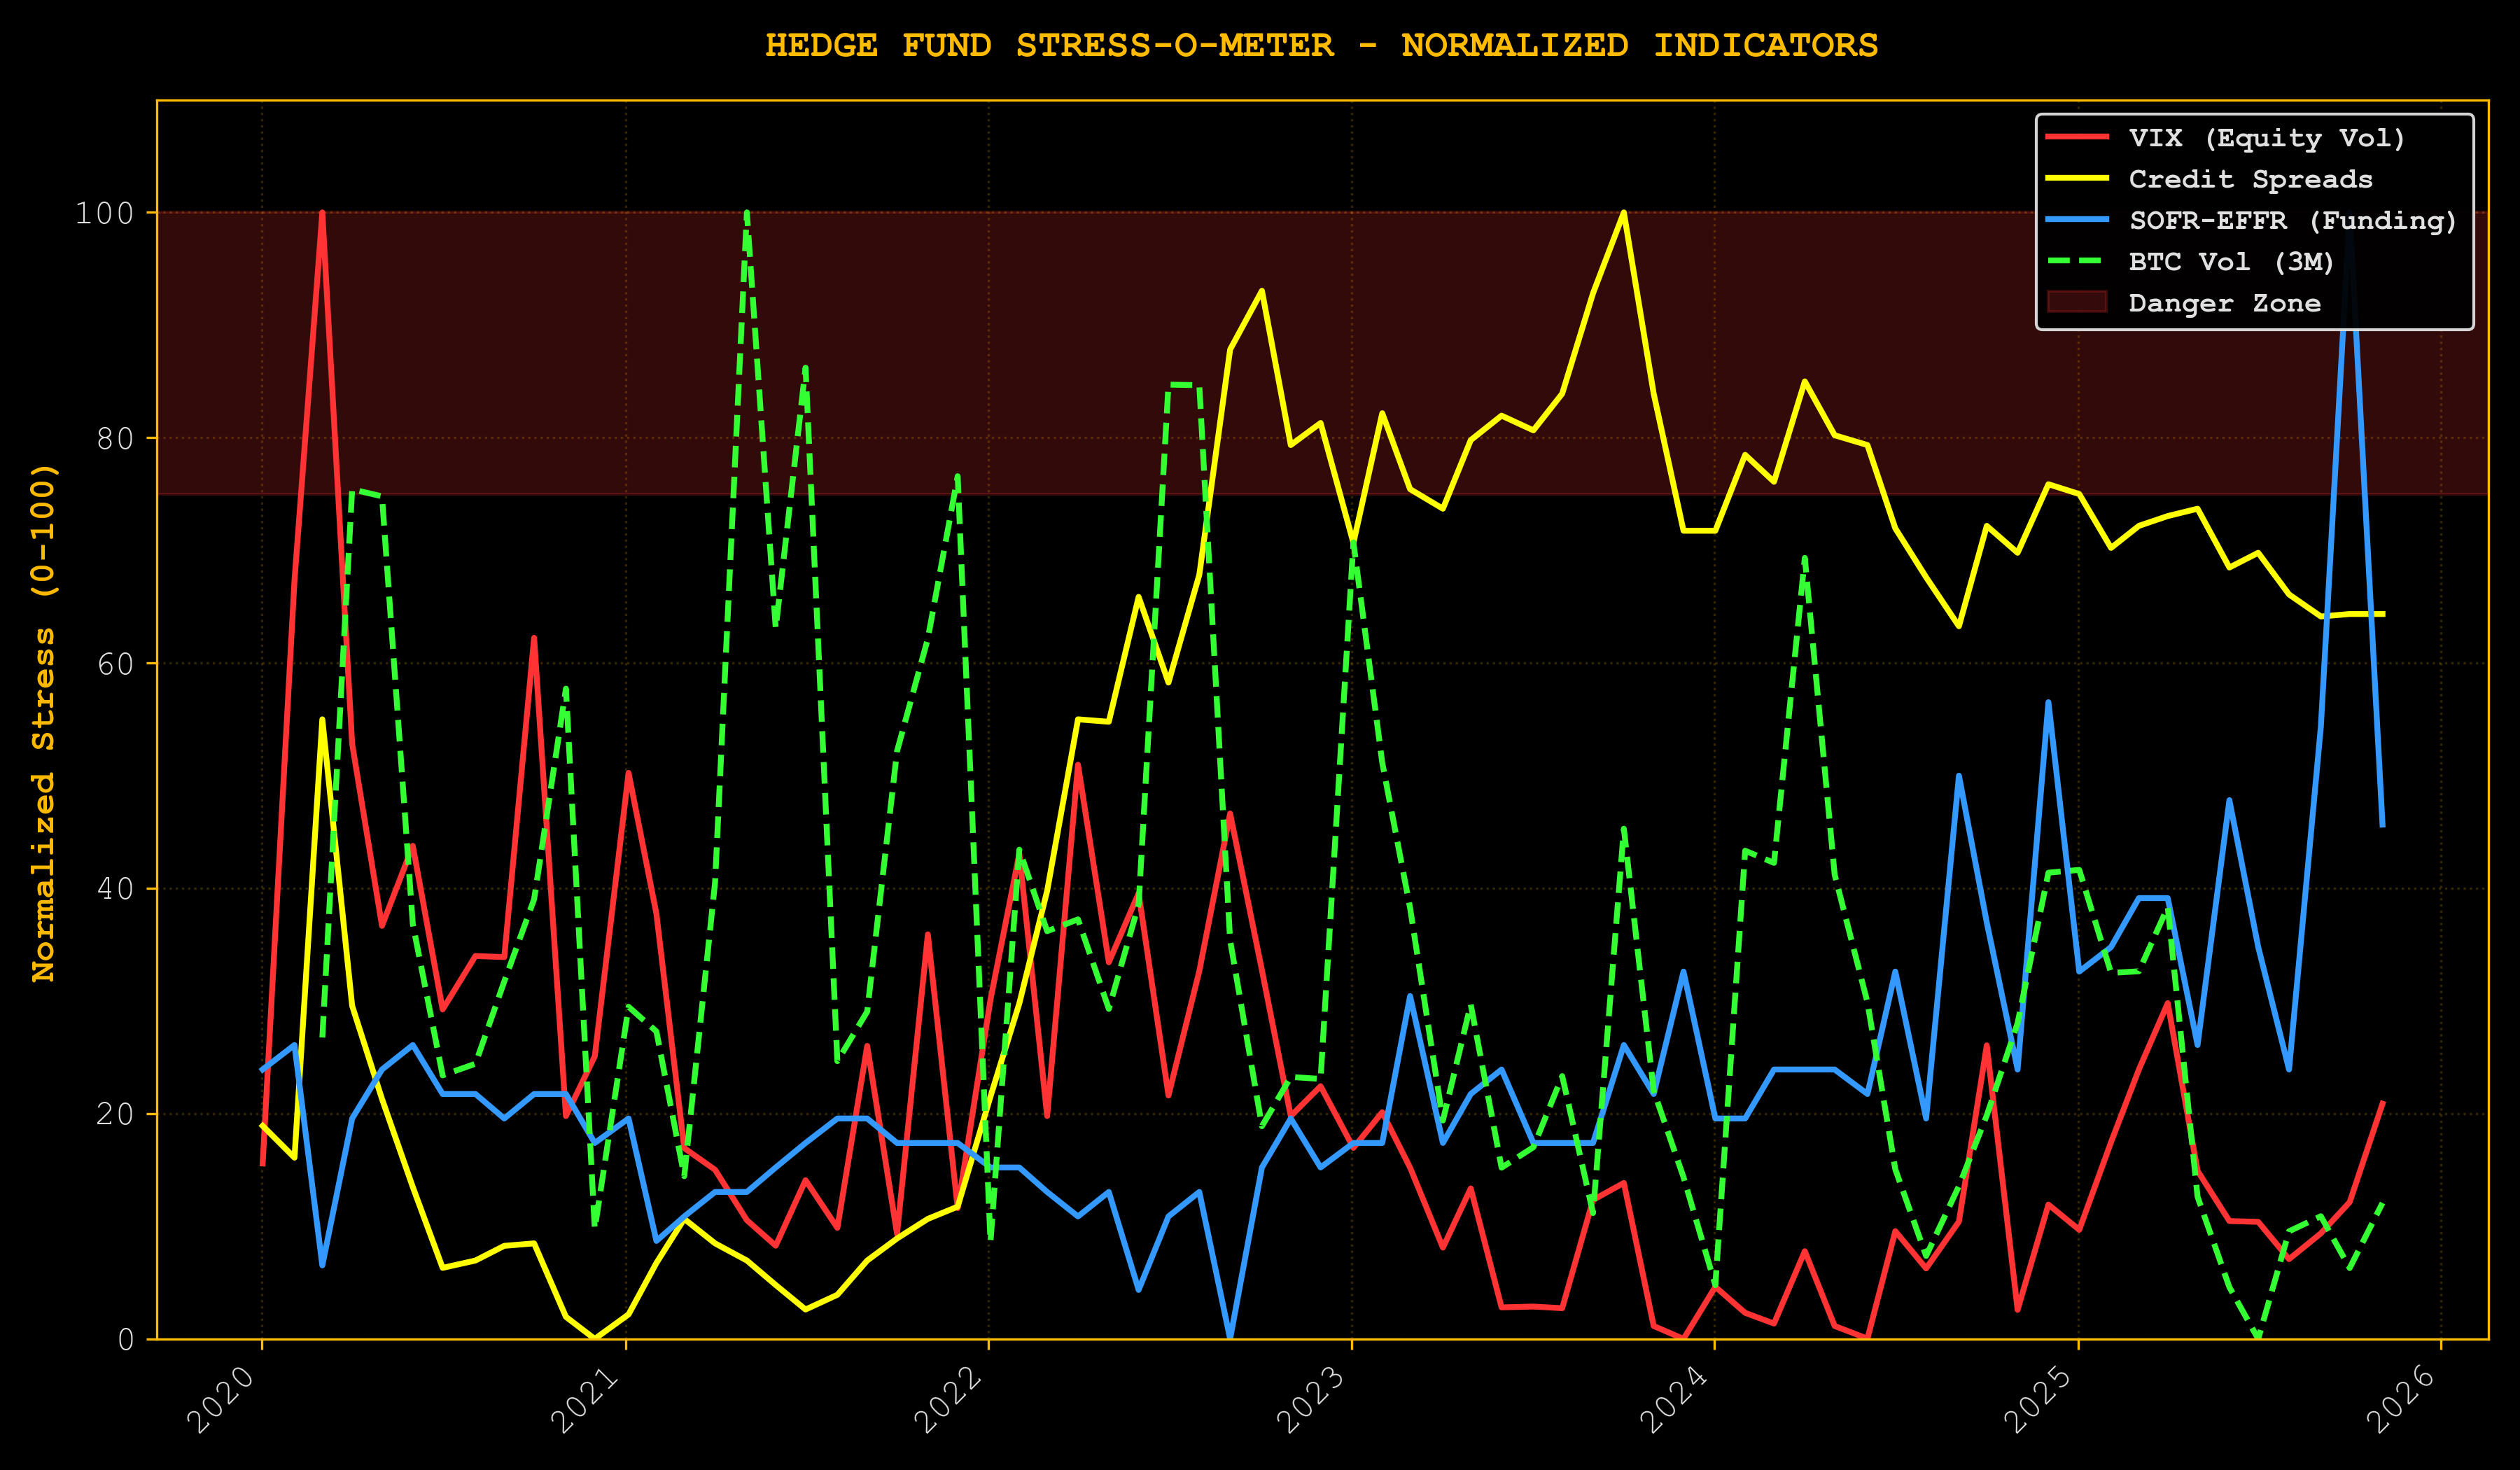
Interpretation: Nervous, not broken.
Note: All stress indicators shown through Nov 2025 (last valid data).
The government shutdown caused a spike in funding stress (SOFR-EFFR spread). But it was brief and sharp, followed by rapid normalization. This is not 2008 systemic seizure—it's temporary dislocation.
Looking at actual data through mid-Nov 2025:
- VIX elevated but not screaming
- Credit markets cautious but functioning
- SOFR-EFFR spread normalized after shutdown spike
The wall of worry is a ladder. Everyone sees the wall. Few see the rungs.
Reading the Wall of Worry Configuration:
The terminal output above encodes 40 years of market history into a single diagnostic. Every major rally since 1980 began with this exact configuration: elevated fear + functioning credit + depressed sentiment. The pattern isn't coincidence—it's structural. Markets require fuel to move, and fear provides that fuel by keeping weak hands sidelined while patient capital accumulates.
The Setup Mechanics:
- VIX elevated (hedging) = Options market pricing in downside risk, creating cheap upside exposure
- Credit functioning = No systemic stress, just sentiment-driven fear
- SOFR-EFFR normalized = Fed maintaining liquidity, plumbing works
- Sentiment at 53.6 = Crowd pessimistic, not yet capitulated
Here's the paradox most traders miss: stress indicators elevated while credit markets function is the exact configuration that precedes major moves higher. If stress indicators were screaming while credit seized up, you'd have 2008—run for the exits. But when indicators show worry without systemic fracture, you're watching the herd panic while the plumbing stays intact. That's the wall of worry in its purest form.
The S&P 500 has seen this movie before. March 2009: VIX at 80, financial system on life support, but the Fed stepped in and credit markets stabilized—SPX ripped 68% over the next year. December 2018: VIX spiked to 36 on Fed tightening fears, everyone called for a recession, credit held—SPX recovered 20% in Q1 2019. March 2020: VIX hit 82, the world shut down, Fed flooded the system with liquidity, credit functioned—100%+ rally in 18 months. October 2023: Middle East tensions, VIX elevated, no systemic credit break—15% rally into year-end. The pattern is clear: when fear is high but the plumbing works, the market climbs the wall of worry. When fear is low and everyone's levered long, that's when you get destroyed.
VIX elevated means options traders are hedging. Credit spreads widening means caution. SOFR-EFFR normalized means the Fed's doing its job keeping funding markets liquid. This isn't a crisis. It's a market pricing in fear that hasn't materialized yet. The professionals aren't panicking. They're watching retail and headline readers capitulate while they quietly position for the other side. Markets don't crash when everyone's hedged and scared. They crash when everyone's complacent and leveraged long. We're in the former, not the latter.
The Volatility Paradox
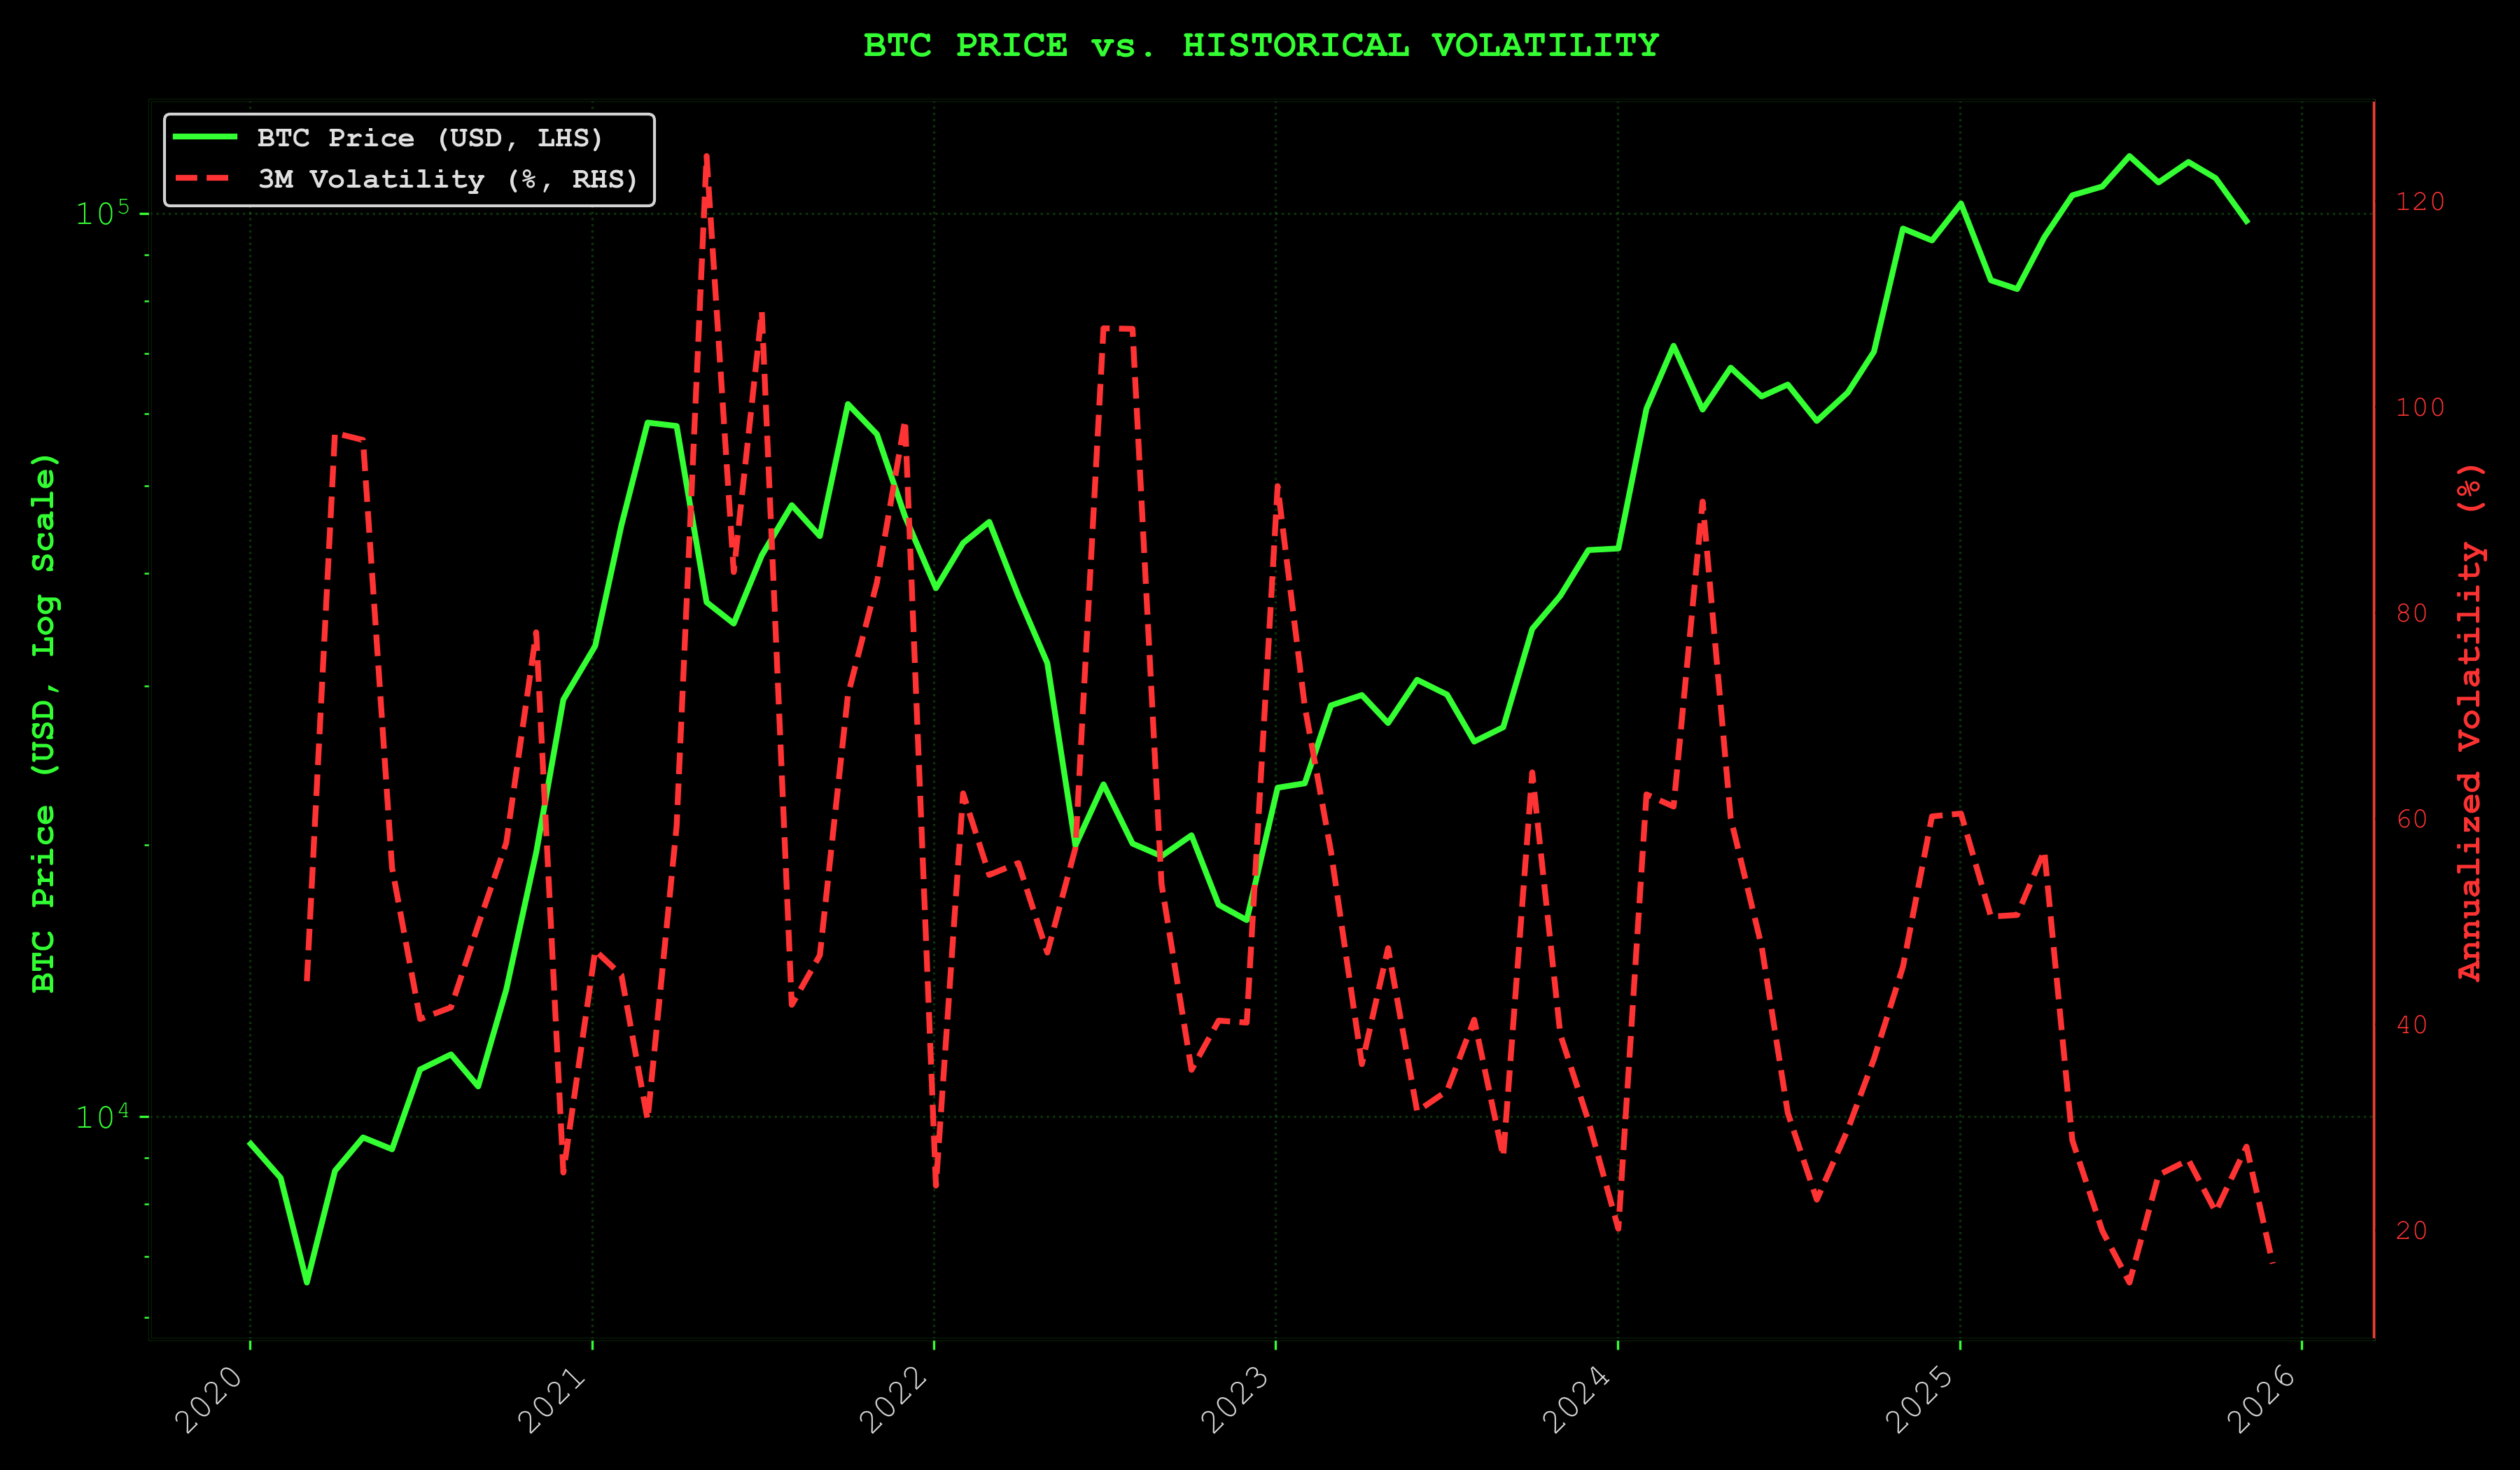
Current Reality:
- Bitcoin Price: $86,000 (volatile - may fluctuate ±10-15% around publication)
- 3-Month Historical Volatility: Elevated (medium-term swings)
- Fear & Greed Index: 14 (Extreme Fear - went as low as 7 on 11/20)
Volatility Caveat: BTC's price is inherently volatile. A move from $86k to $95k (or $75k) doesn't invalidate the core thesis—liquidity conditions and risk metrics adjust dynamically. What matters is the relationship between price, liquidity, and sentiment, not the absolute dollar figure.
Understanding 3-Month Volatility:
The chart shows 3-month rolling volatility alongside BTC price. This medium-term view captures the actual turbulence investors are experiencing—not just daily noise, but the sustained price swings that test conviction. When volatility is elevated while price holds near previous highs, it signals market uncertainty. Traders are hedging aggressively, unsure whether this is consolidation before breakout or distribution before breakdown.
The Volatility Paradox:
Bitcoin at $86,000 while volatility stays elevated. Normally, prices consolidating would see volatility collapse as the market finds equilibrium. Instead, the market is pricing in fear—options traders hedging heavily, investors selling rallies, everyone expecting the other shoe to drop.
This is the paradox. Price holding strong, fear at extreme levels (16), volatility refusing to compress. The wall of worry in its purest form.
Risk Appetite Proxy: The RICK/GOLD Indicator
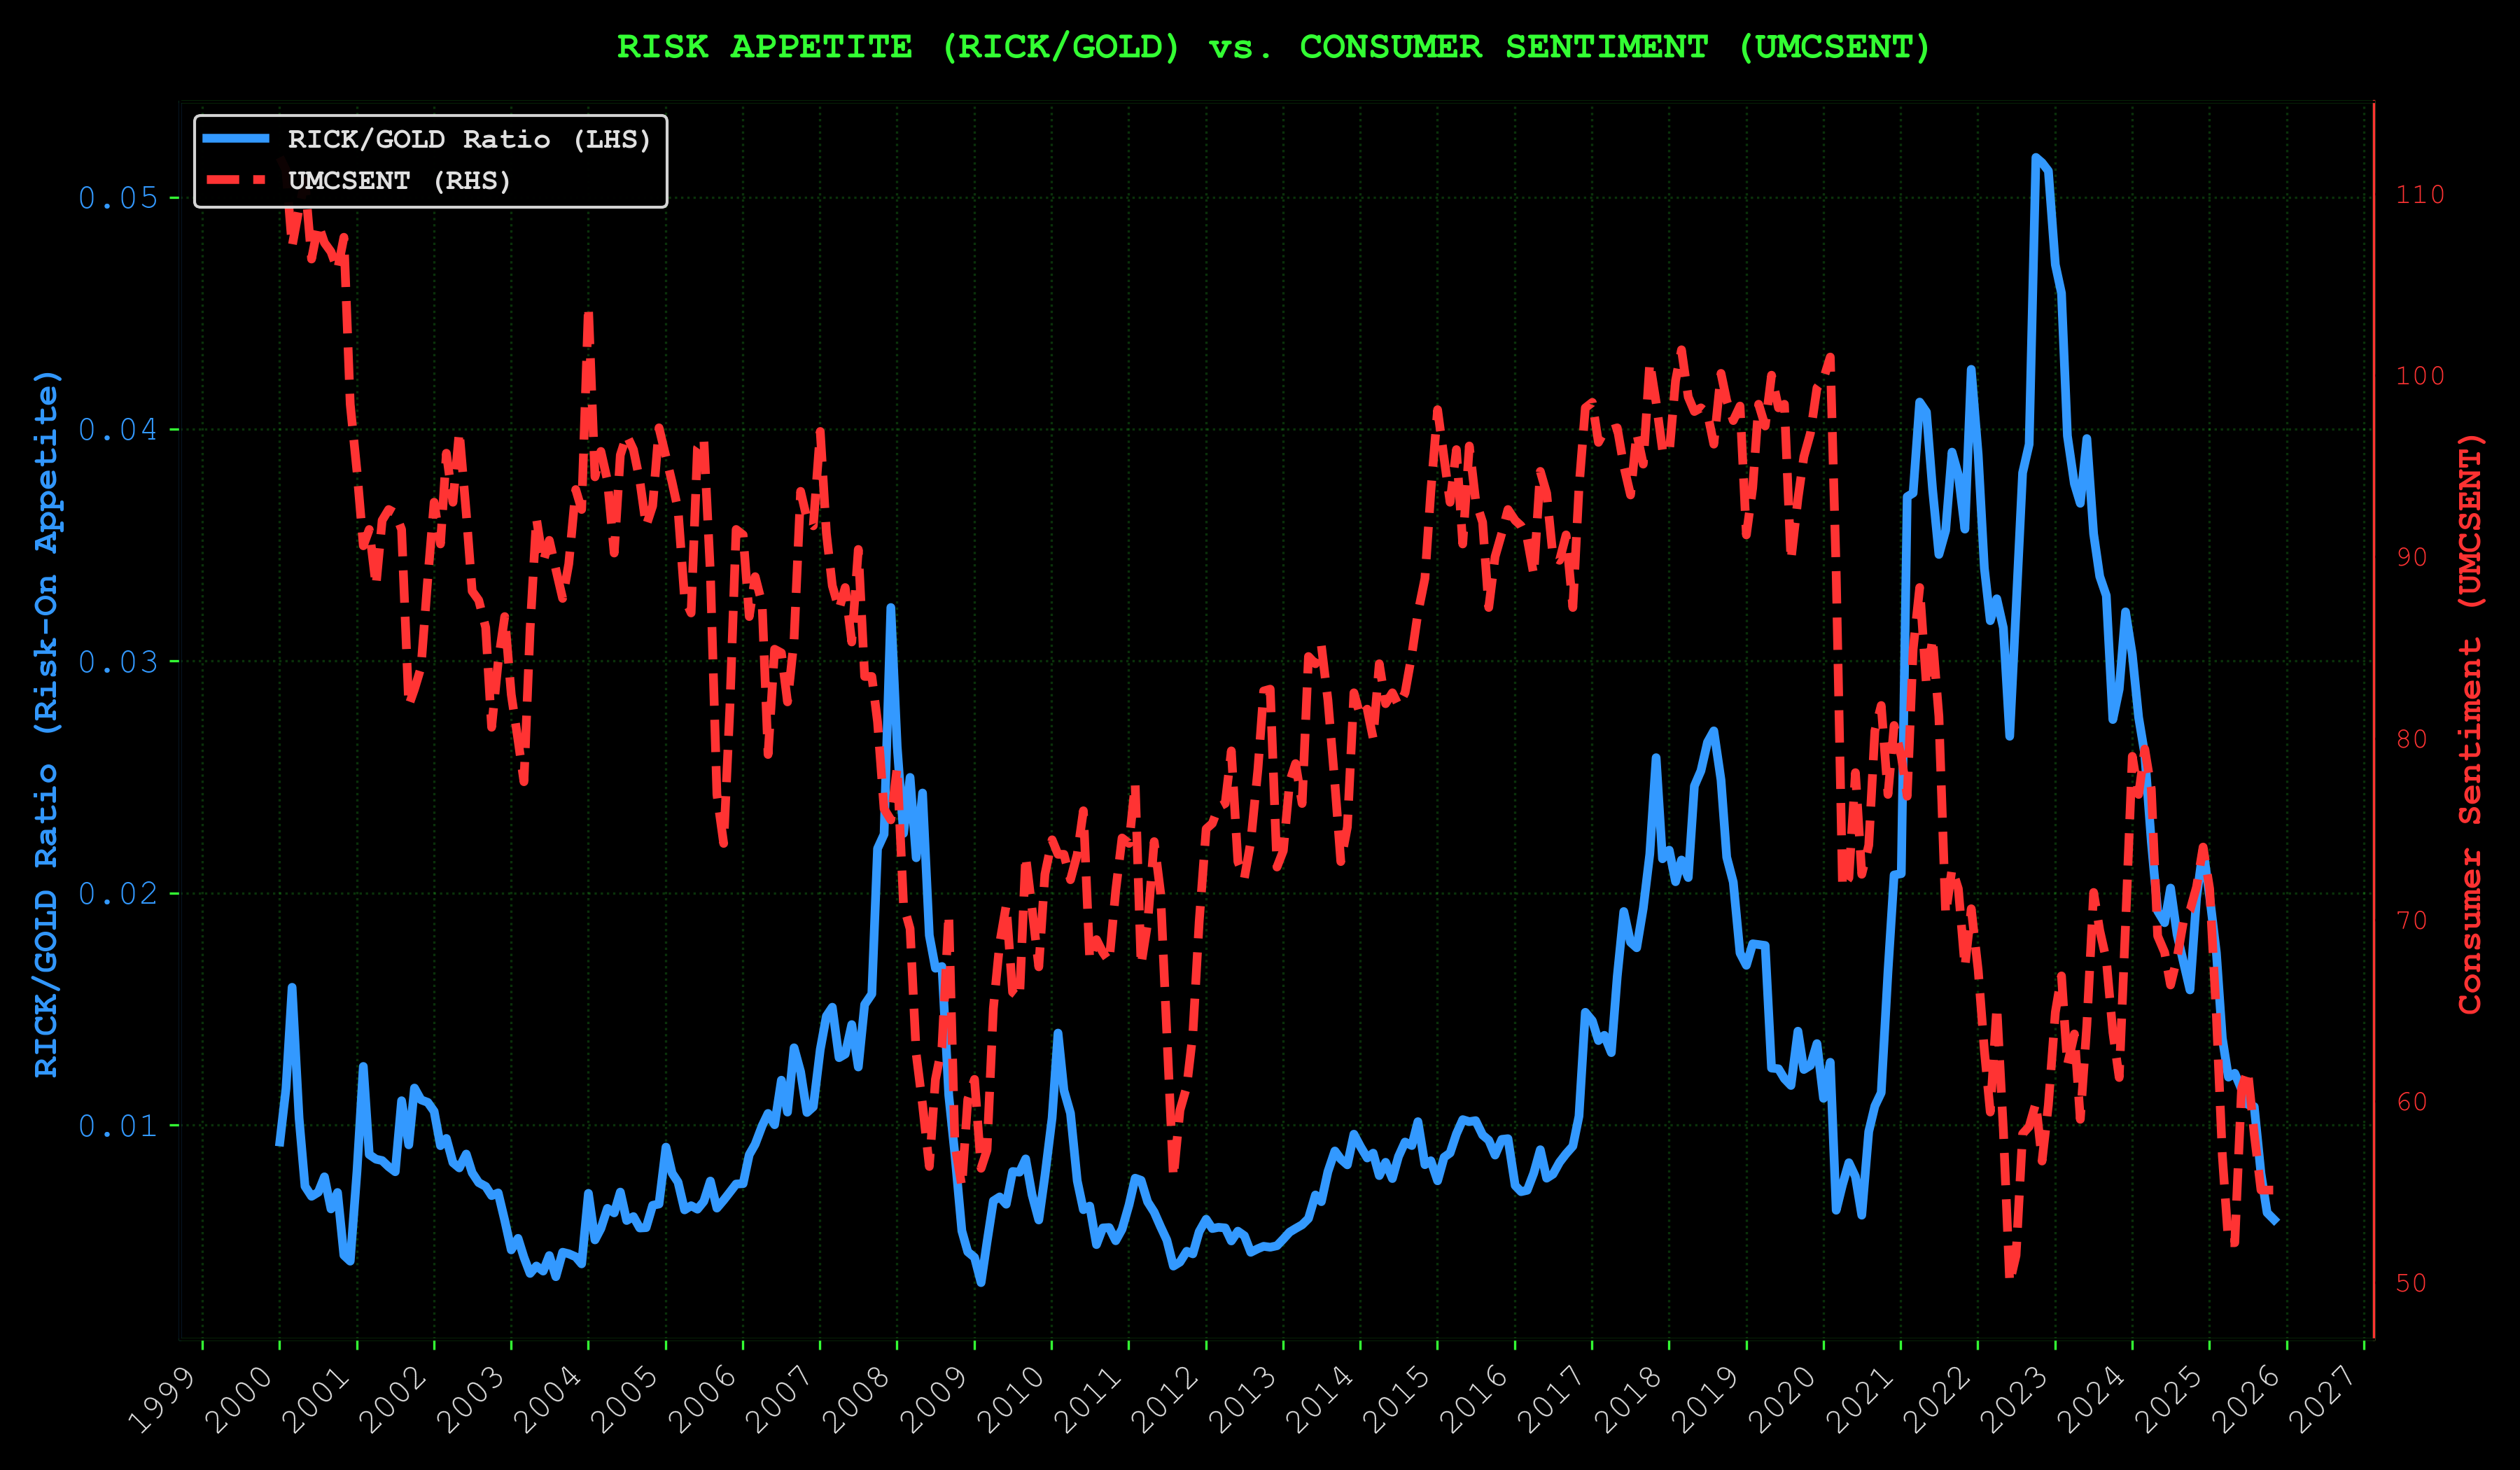
Risk Appetite, Disposable Income, and the Wealth Effect:
The RICK/GOLD ratio—ticker symbol for a publicly traded adult entertainment company versus the oldest store of value known to man—serves dual purposes: risk appetite proxy (willingness to spend on discretionary entertainment) and disposable income indicator (ability to spend beyond essentials).
When Americans have disposable income, they go to strip clubs. When they don't, they hoard gold. This is not a joke. This is an actual economic indicator, and it works. When this ratio climbs, it signals consumers feeling wealthy enough to burn cash on frivolous spending—exactly the psychological prerequisite for risk assets to moon.
Why both matter for crypto:
-
Disposable income enables participation: Risk assets need buyers with excess capital. When consumers are financially squeezed (credit card debt at $1.23T, real wages stagnant), they can't allocate to speculative assets even if they want to. The RICK/GOLD ratio recovering suggests pockets of disposable income are returning—not widespread, but growing.
-
Wealth effect drives risk-taking: Sustainable bull markets historically require broad consumer participation. Not just institutional flows, but retail FOMO driven by households feeling wealthy. The RICK/GOLD ratio climbing from deeply depressed levels (currently down 80% from peak) indicates the early stages of consumers feeling confident enough to spend frivolously again. That's the precursor to risk asset euphoria.
-
The class divergence: RICK/GOLD recovering while sentiment stays pessimistic (53.6) isn't a contradiction—it's a signal that early movers with capital are positioning while the broader public remains locked out. Some Americans can still afford the strip club. Most can't. This is classic wall-of-worry behavior: those with resources accumulate while the crowd stays paralyzed by fear. The American Dream, reduced to a leading economic indicator.
Current reading: RICK/GOLD still deeply suppressed but showing signs of stabilization. Not euphoria yet. We need consumers to feel wealthy, not just surviving. But the direction matters. When disposable income improves and risk appetite follows, that's when retail rushes in and the real vertical move happens.
Textbook wall of worry:
- Asset prices climbing
- Sentiment depressed
- Risk appetite recovering (for those with capital)
The best trades feel terrible. The worst trades feel amazing.
Right now, at $86k with a fear index of 16, it feels terrible. And recent volatility makes it feel even worse.
Volatility is the market's way of shaking out the tourists. The day traders with leveraged longs, the retail gamblers who sized too big, the weak hands who bought at the top and are still underwater—they're all getting shaken out by these wild swings. Meanwhile, the patient capital that understands liquidity cycles and risk models? They're buying the dips and waiting for the crowd to capitulate completely.
High volatility with low sentiment is opportunity, not danger. It means the market hasn't found its footing yet, which means there's still alpha to be captured before the consensus forms and the easy money is gone. When volatility finally compresses and fear subsides, that's when you know the move is over and it's time to take profits. But right now? With volatility elevated and sentiment in the gutter? This is the accumulation phase where fortunes get built by those disciplined enough to act against their emotions.
That's the signal for those positioned to act on it. Price volatility is noise. The LP+Risk composite signal is what matters.
The paradox creates the edge. When Bitcoin holds $86k while volatility stays elevated and fear dominates, most traders see danger and step aside. They wait for "confirmation"—which usually means waiting until volatility compresses, sentiment improves, and price has already moved 30% higher. By then, the risk-reward is inverted: you're buying into declining volatility with improving sentiment, which is exactly when reversals happen.
Smart money does the opposite. They buy elevated volatility with depressed sentiment because that's when assets are mispriced. The market is pricing in catastrophe (high vol + extreme fear) while liquidity models show recovery (LP_Composite +0.32σ). That mismatch is the trade. When volatility compresses and sentiment catches up to reality, that's not the entry—that's the exit. The edge exists in the discomfort. If it felt good, everyone would be doing it, and the opportunity would be gone.
C. The Regime Signals
"Seven instruments. One question: do you trust what you see, or what you're told to see?"
Seven instruments that tell you whether the old map still works.
S&P/Gold: The Risk Asset Test
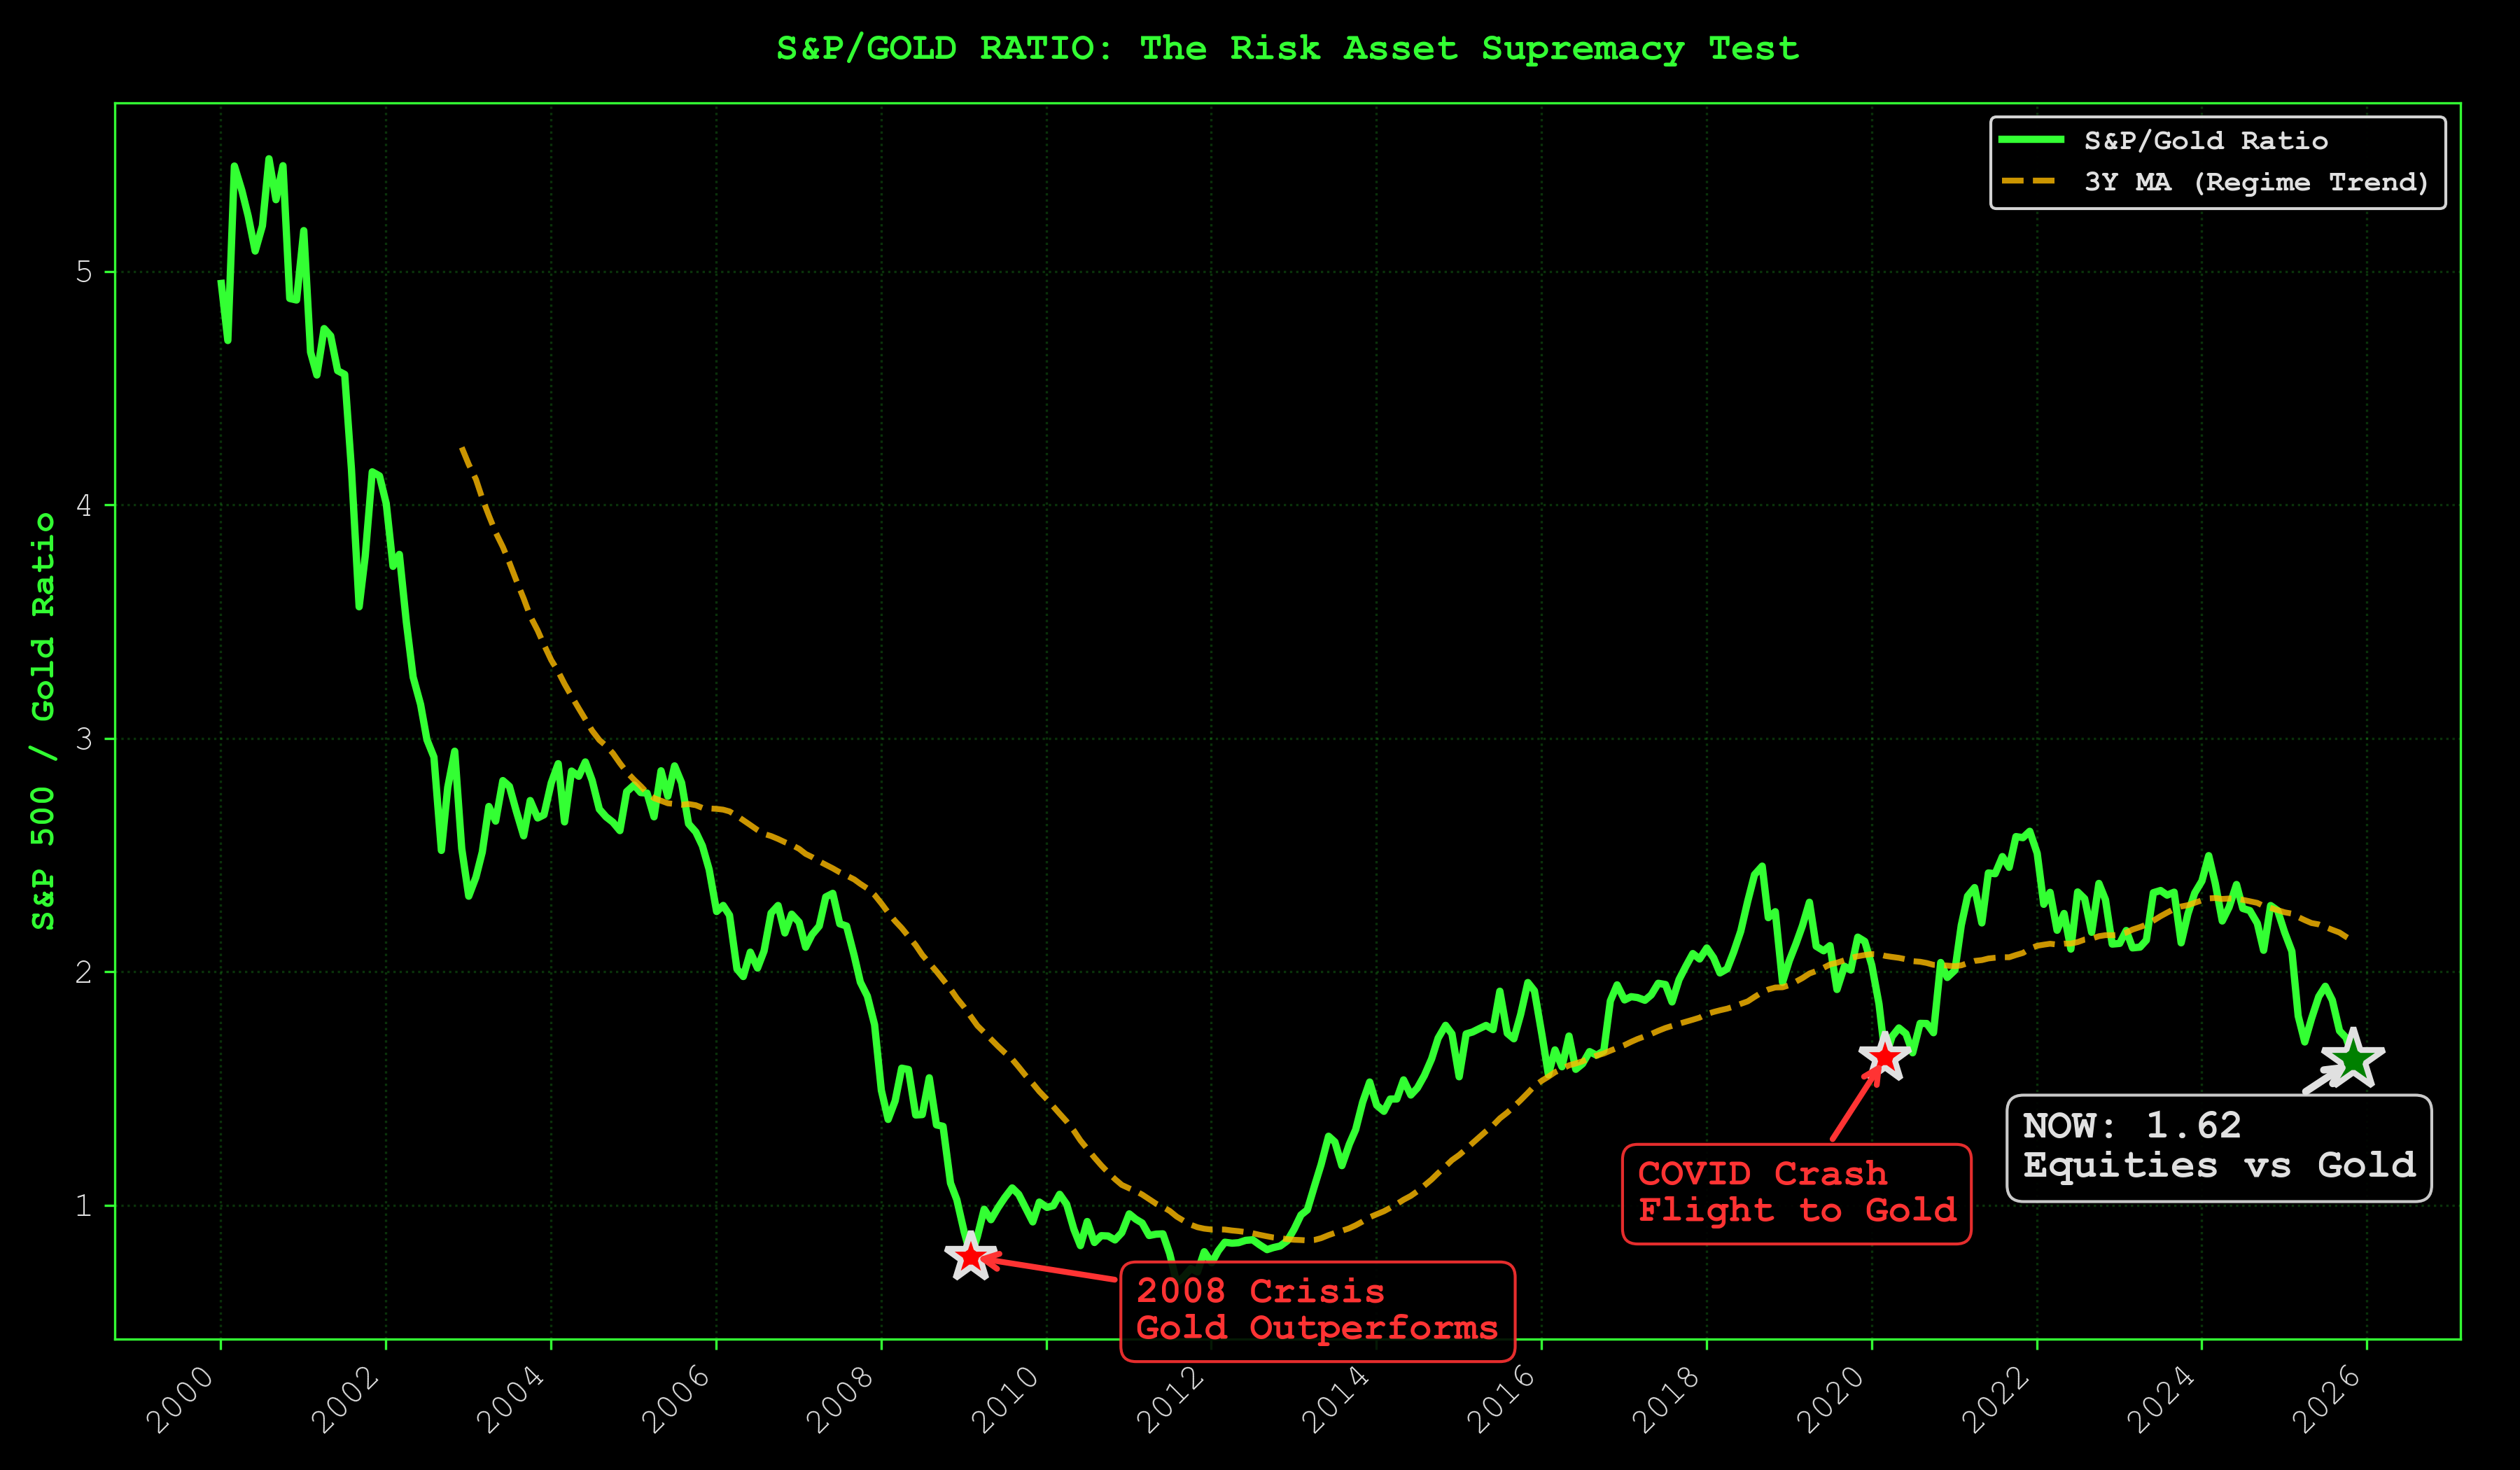
Current: ~1.7 (building risk-on)
The oldest trade: equities vs monetary metal. Risk-on vs safe haven.
Recent regime thresholds (post-2020 pattern):
- >2.2: Late-cycle risk euphoria (distribution zone, take profits)
- 1.5-2.2: Risk-on confirmed (accumulation to early euphoria)
- <1.5: Risk-off / defensive (gold outperforming, stay cautious)
Note: Pre-2008 thresholds don't apply in the current regime. Post-GFC era (especially post-2020) shows different inflection points due to structural changes in monetary policy and asset correlations. These updated levels reflect behavior since the Fed's permanent QE regime began.
At ~1.7, we're in the early risk-on zone. Not euphoria yet, but the trend is building. The chart shows both the raw S&P/Gold ratio and its 5-year moving average. The MA captures the secular trend, filtering out noise.
Currently testing the 5-year MA from above. If liquidity continues recovering, this breaks higher toward the 2.0+ risk-on zone. If recession hits, it collapses back toward defensive territory.
Watch for: Break above 2.0 = risk-on accelerating. Break below 1.5 = risk-off (defensive positioning warranted).
Dollar Hegemony Watch (DXY vs Gold)
The dollar regime is showing cracks. This chart tracks the divergence between USD strength (DXY) and gold. When both rise together (unusual), it signals regime uncertainty: global capital seeking safety in both the dollar AND its historical alternative.
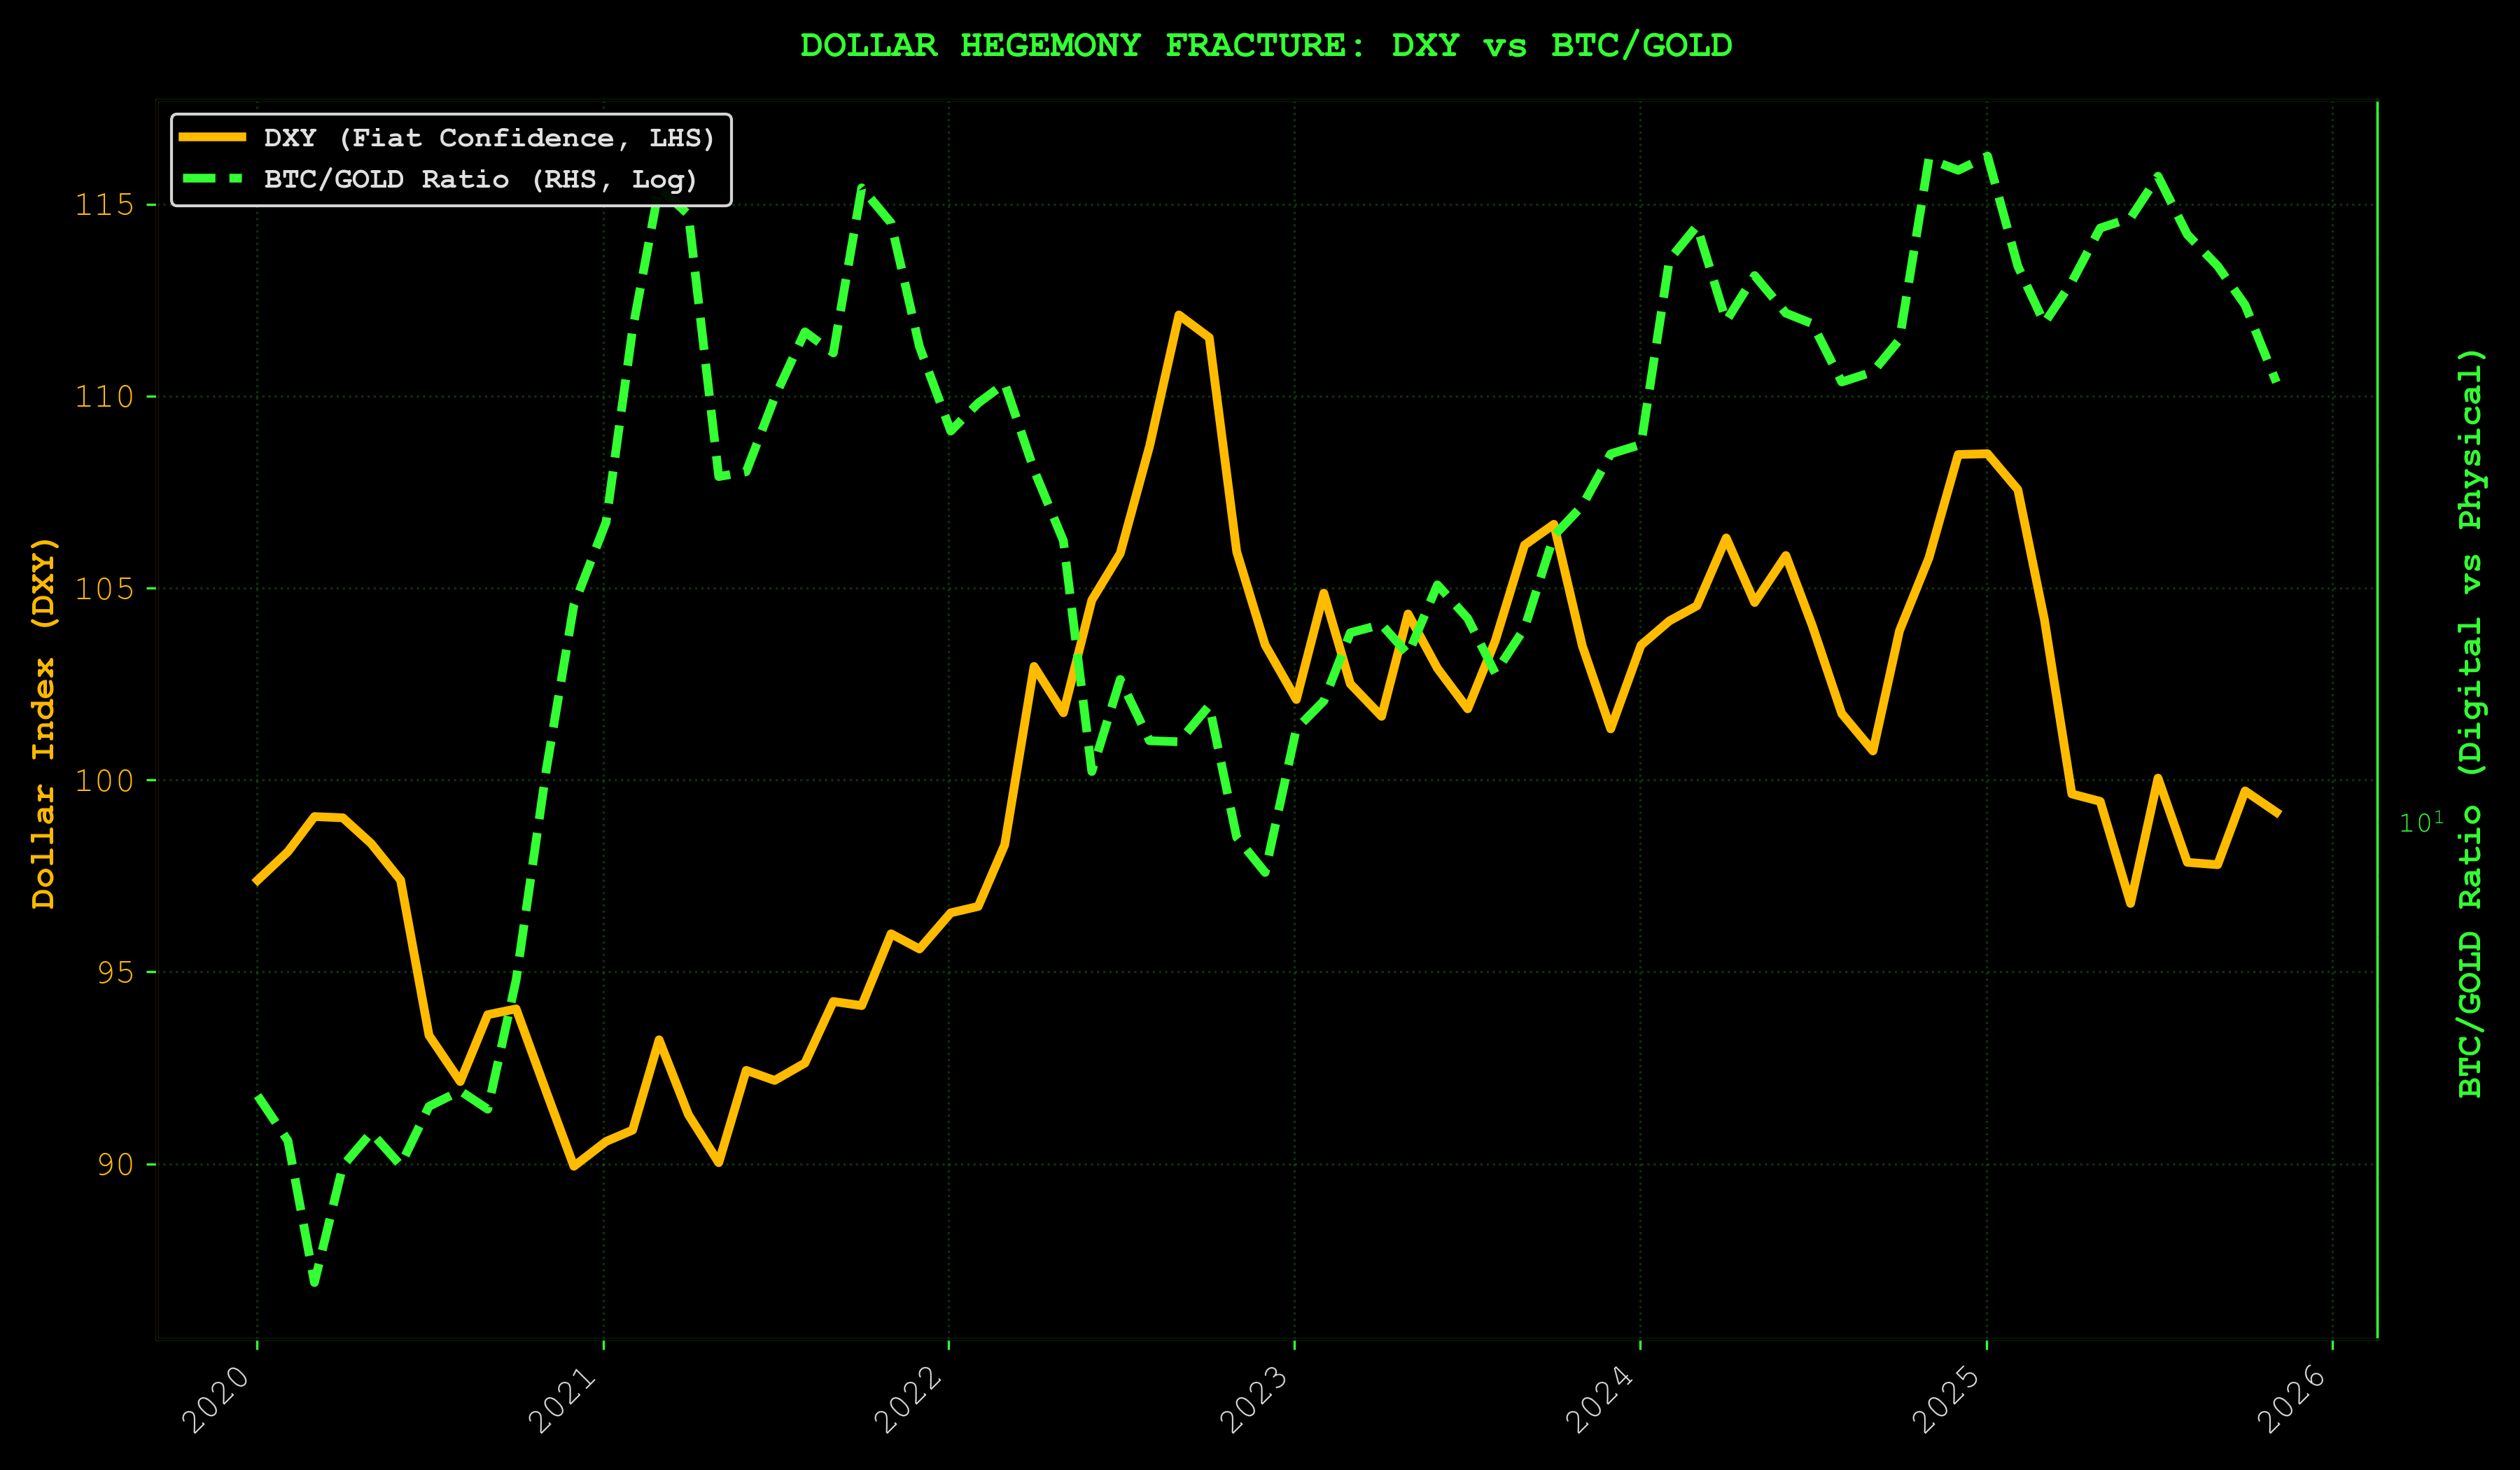
What Nov 2025 Data Shows:
Through Nov 2025, we're seeing a critical inflection point. Gold holding near all-time highs (~$4,000-4,121/oz) while the dollar index (DXY) remains elevated above 99. Historically, these assets move inversely: dollar strength crushes gold, gold strength signals dollar weakness. When both are elevated simultaneously, it reveals deep uncertainty about the global monetary regime itself.
Investors aren't choosing between the dollar and gold. They're hedging both because neither feels safe. Central banks continue accumulating gold reserves while dollar liquidity remains the backbone of global finance. This bifurcation matters because it signals loss of confidence in traditional monetary anchors. Exactly the environment where scarce digital assets (Bitcoin) historically outperform as the "alternative to the alternative."
The DXY represents the dollar's strength against a basket of major currencies. Gold represents the oldest store of value. Normally these move inversely: strong dollar = weak gold (dollar is the safe haven), weak dollar = strong gold (gold is the safe haven). When both rise simultaneously, it signals confusion. No clear safe haven, hedging in both directions.
Why it matters: If dollar hegemony cracks further, Bitcoin's "digital gold" narrative strengthens. Monitor for continued divergence between DXY and gold.
Cross-Asset Stress: VIX vs MOVE
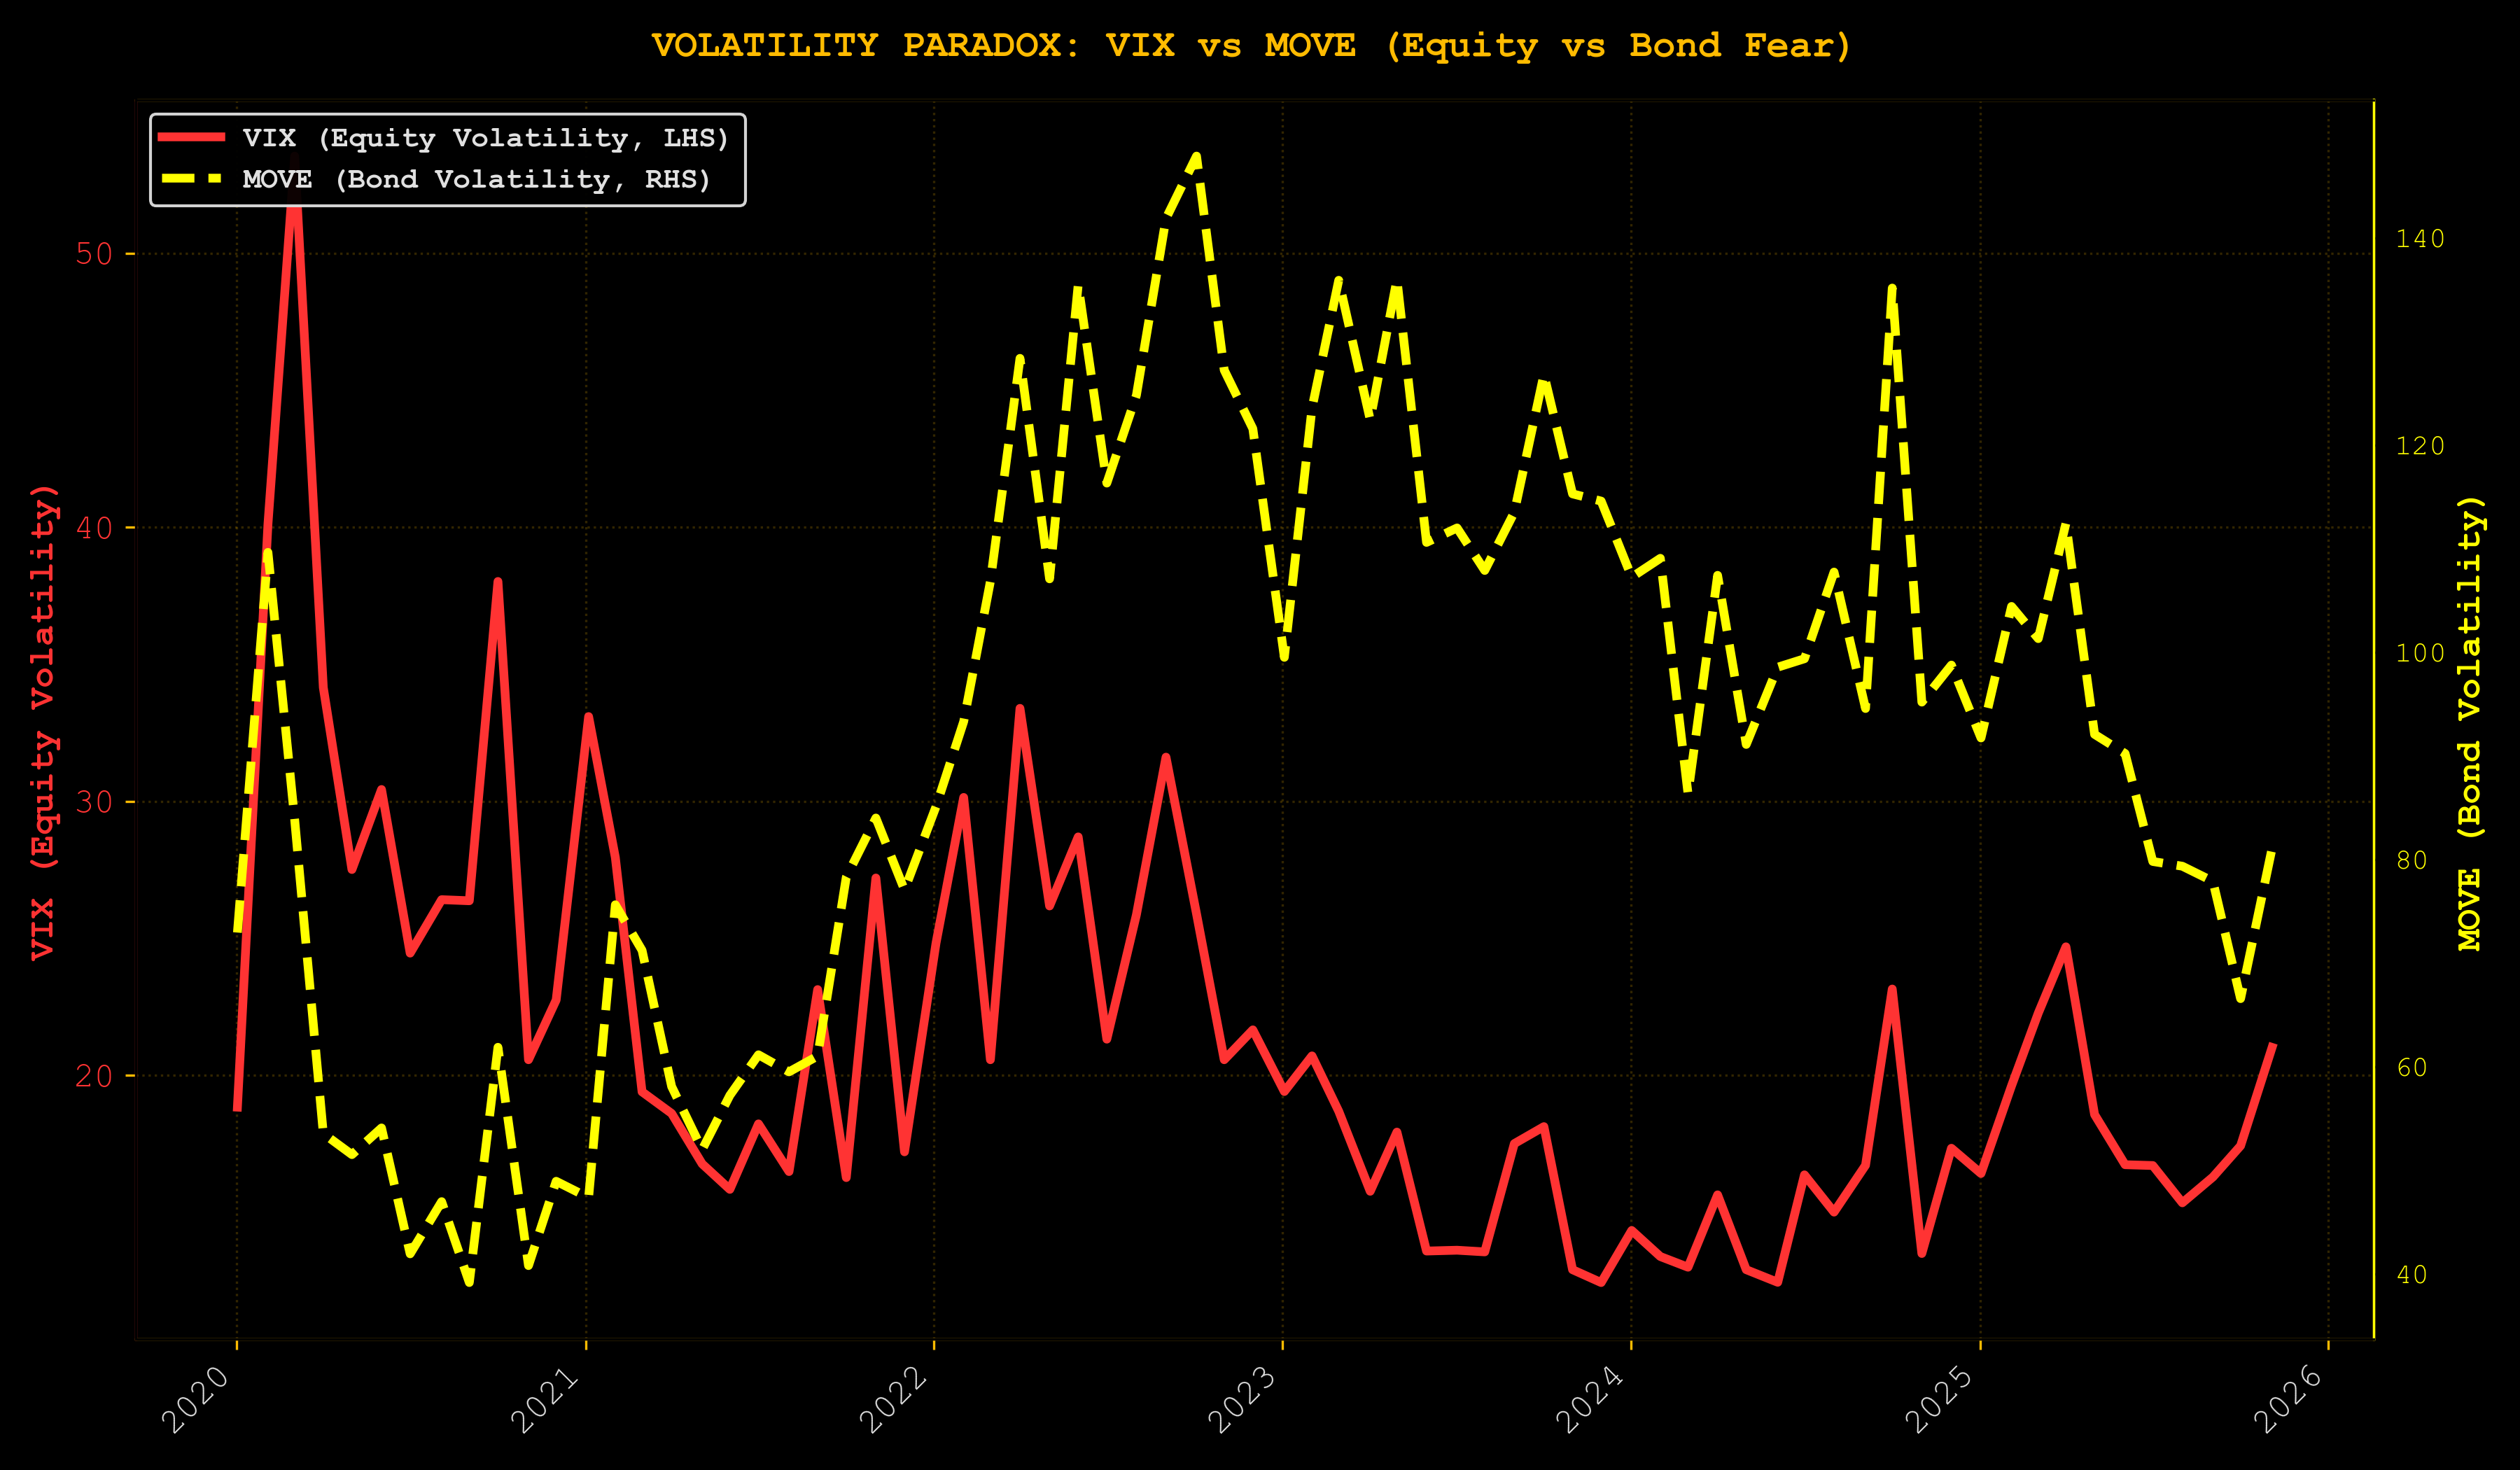
Understanding VIX and MOVE:
-
VIX (CBOE Volatility Index): Measures implied volatility of S&P 500 options. Proxy for equity market fear and risk sentiment. When VIX spikes, equity investors are hedging aggressively (expecting turbulence).
-
MOVE (Merrill Lynch Option Volatility Estimate): Measures implied volatility of Treasury options. Proxy for interest rate and bond market volatility. Critically, MOVE reflects stress in the collateral system. Treasuries are "pristine collateral" that underpin the entire repo and funding market.
Why VIX vs MOVE matters:
-
When both spike together: Systemic stress across asset classes. Credit conditions tightening, liquidity draining, risk-off across the board. This is 2008, March 2020.
-
When MOVE spikes but VIX doesn't: Bond market stress is isolated. Fed intervention likely to stabilize funding. Equities may be temporarily insulated.
-
When VIX spikes but MOVE doesn't: Equity-specific fear (earnings, sector rotation) without broader funding stress. Usually less severe, faster to resolve.
Current: MOVE elevated relative to VIX, bond market stress exceeding equity stress. This often precedes Fed action (rate cuts or liquidity injections to stabilize fixed income and the collateral system).
The Liquidity/Credit Nexus: MOVE, DXY, and SOFR-EFFR
In a debt-based economy, credit extension and liquidity are shaped by three interconnected forces:
-
MOVE (Collateral System Stress): When Treasury volatility rises, the collateral underpinning repo markets becomes less reliable. Banks demand larger haircuts, lending contracts, funding tightens. MOVE spikes = collateral stress = credit contraction.
-
DXY (Global Dollar Price): A rising DXY means dollars are scarce globally. Emerging markets with dollar-denominated debt struggle. Offshore dollar funding tightens. DXY strength = global dollar scarcity = deflationary pressure on risk assets.
-
SOFR-EFFR Spread (Funding Market Tightness): The spread between Secured Overnight Financing Rate and Effective Fed Funds Rate measures stress in overnight funding markets. A positive spread (SOFR > EFFR) means secured lending (repos) is more expensive than unsecured. Banks are hoarding Treasuries or there's collateral scarcity. A negative spread means abundant collateral and easy funding.
How they connect:
-
MOVE ↑ + DXY ↑ + SOFR-EFFR ↑ = Maximum stress. Collateral volatile, dollars scarce, funding tight. Credit extension choked off. Risk assets under severe pressure.
-
MOVE ↓ + DXY ↓ + SOFR-EFFR ↓ = Goldilocks. Stable collateral, abundant dollars, easy funding. Credit flowing freely. Risk-on environment.
-
Mixed signals require interpretation. Currently: MOVE elevated (bond stress), DXY strong (dollar scarcity), SOFR-EFFR normalizing (funding easing). The collateral and dollar stress are being offset by Fed operations in funding markets. Nervous but functional.
The takeaway: To understand when credit is being encouraged vs choked off, watch these three together. They tell you more about monetary conditions than Fed Funds alone.
This is where most macro analysts get lost in the weeds. They watch the Fed funds rate like it's the only variable that matters, completely ignoring the transmission mechanism that determines whether liquidity actually reaches risk assets. The Fed can cut rates all day long, but if MOVE is spiking and DXY is ripping higher while funding markets seize up, that liquidity never makes it to Bitcoin or equities—it gets trapped in the collateral system as banks hoard Treasuries and liquidity disappears into the plumbing.
Right now we have the opposite problem: mixed signals that the algos can't parse but experienced traders recognize as pre-expansion configuration. MOVE elevated means bond volatility, which typically precedes Fed intervention. DXY strong means the dollar shortage that always gets resolved with liquidity injections or swap lines. SOFR-EFFR normalizing means the Fed's already greasing the gears in funding markets. This isn't a credit crisis forming. This is a credit system under stress that central banks know how to fix. They've done it before. They'll do it again. And when they do, the liquidity flows to risk assets first, not last.
Growth Optimism vs Policy: Copper/Gold Paradox
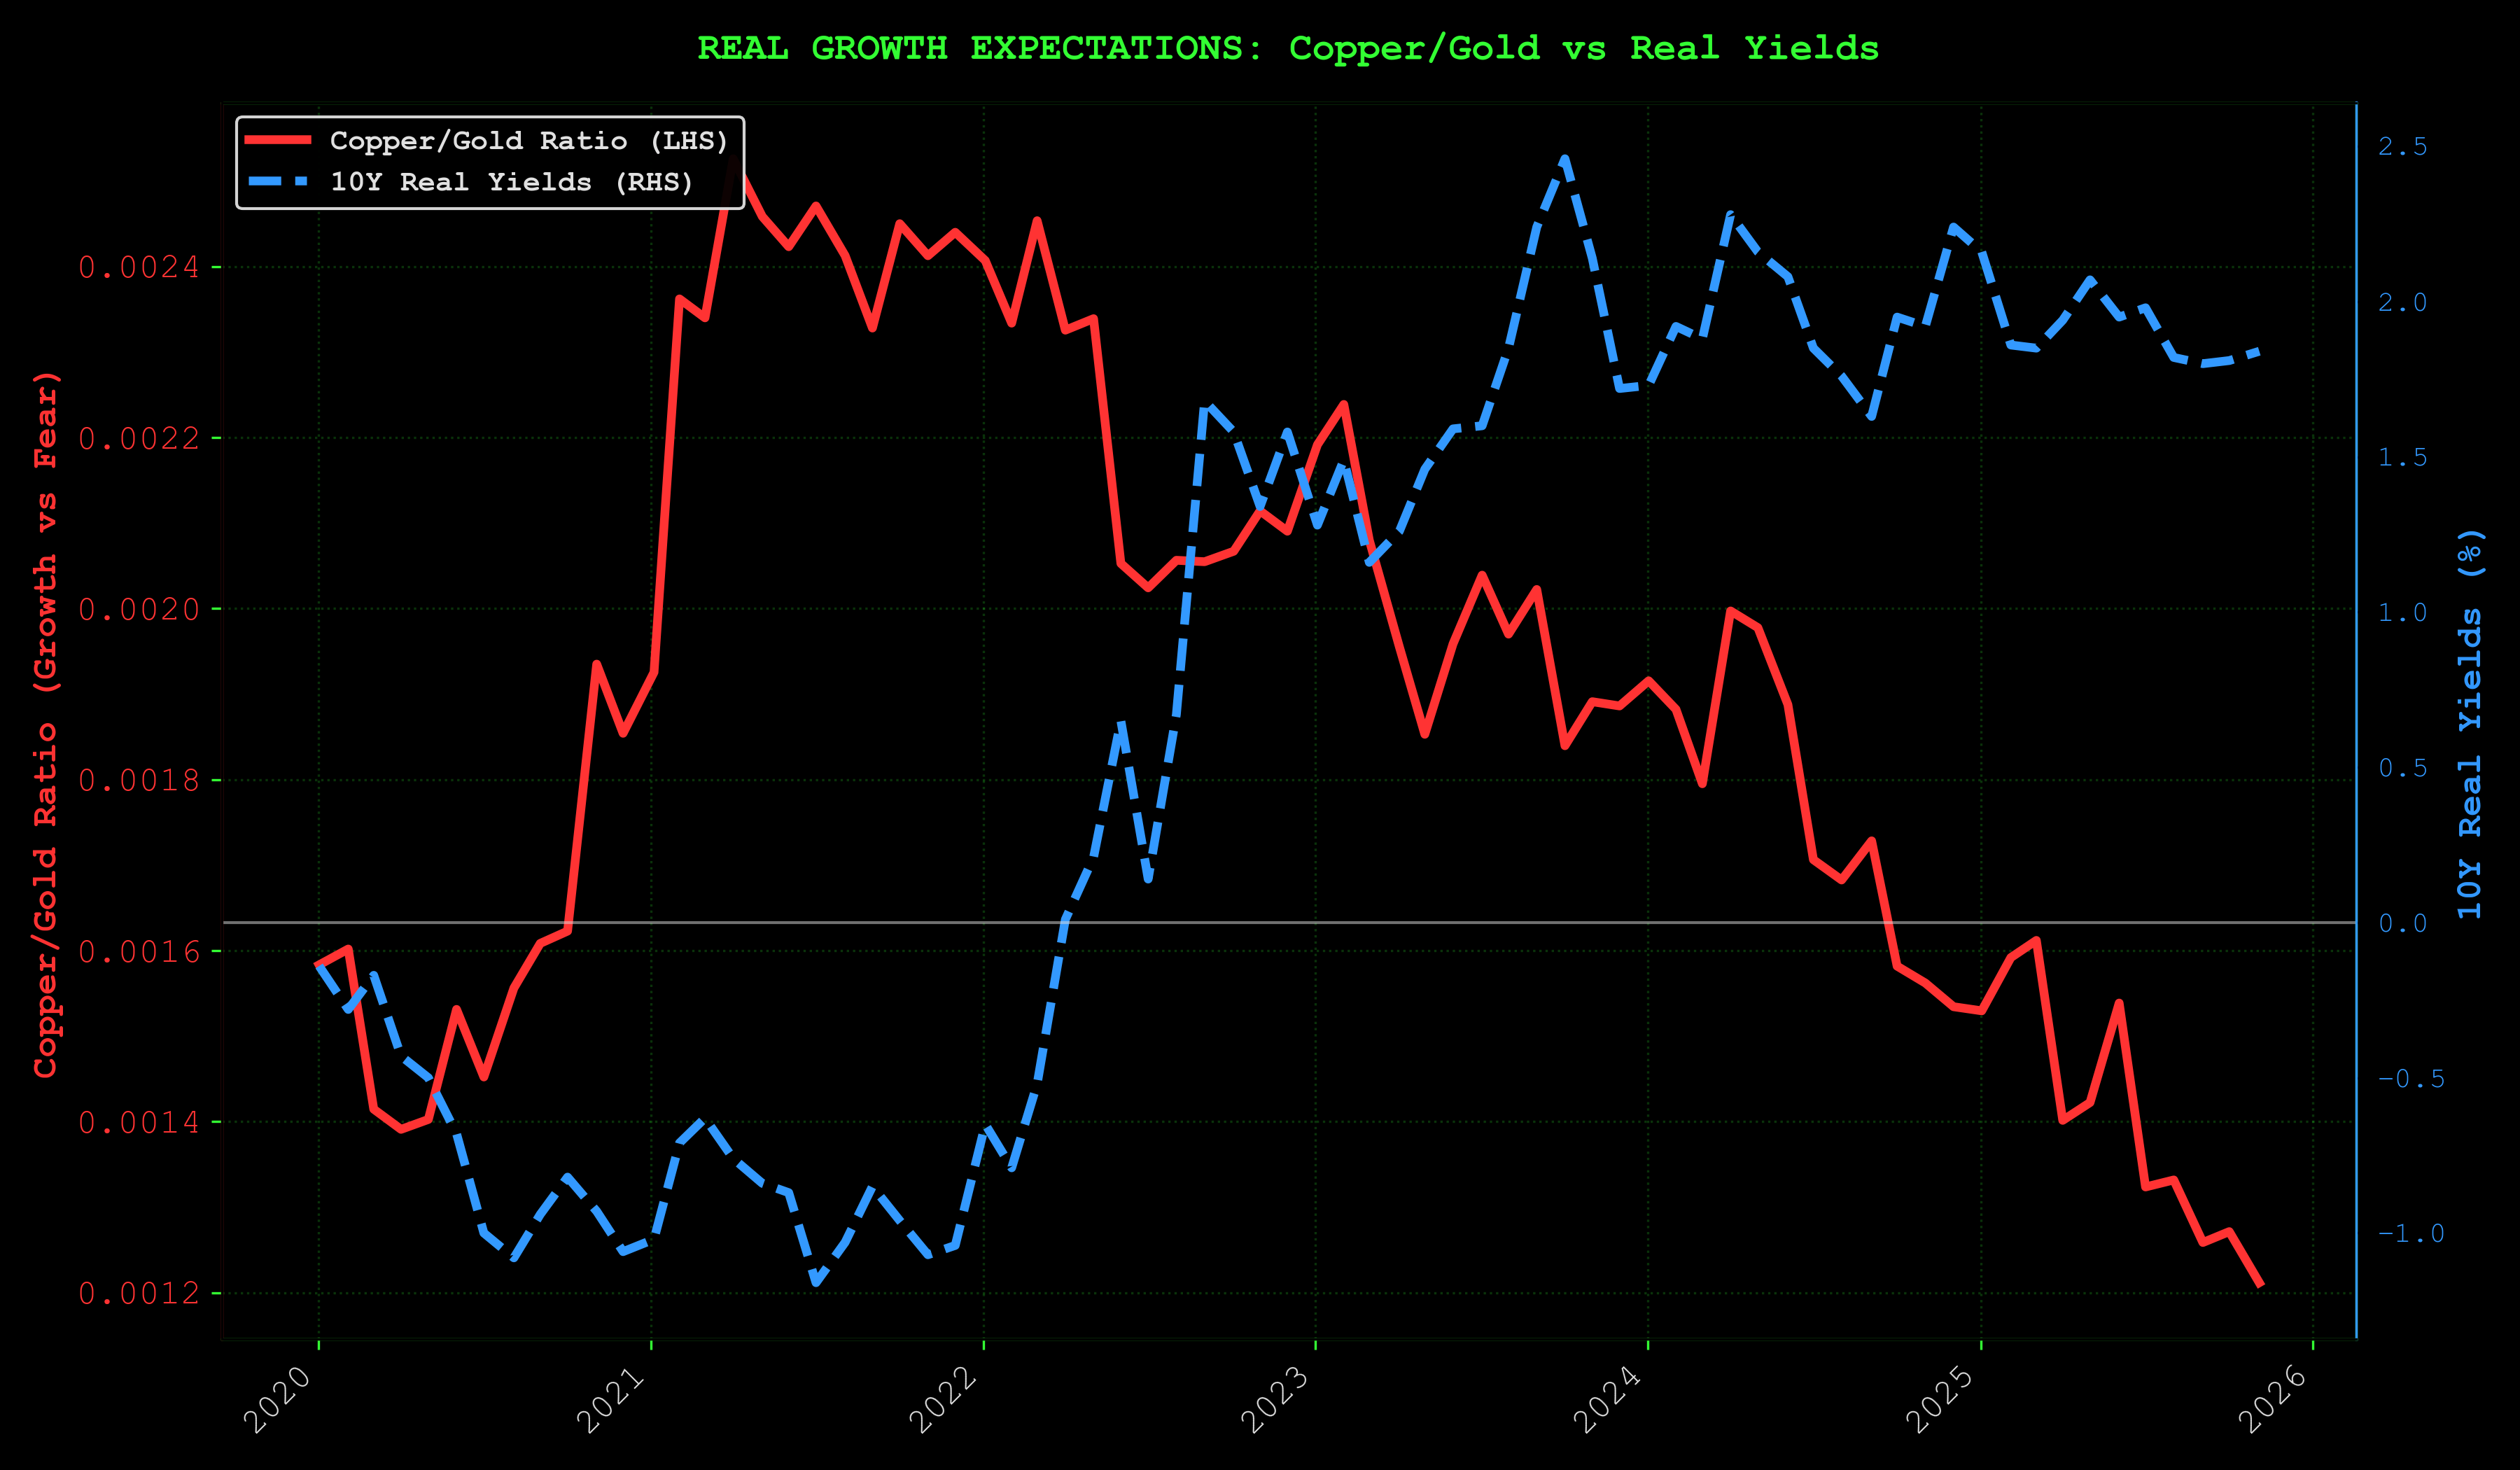
Copper/Gold ratio (growth expectations) vs real yields. When copper outperforms gold while real yields fall, it signals growth optimism + accommodative policy. The goldilocks setup for risk assets.
BTC Dominance: The Rotation Detector
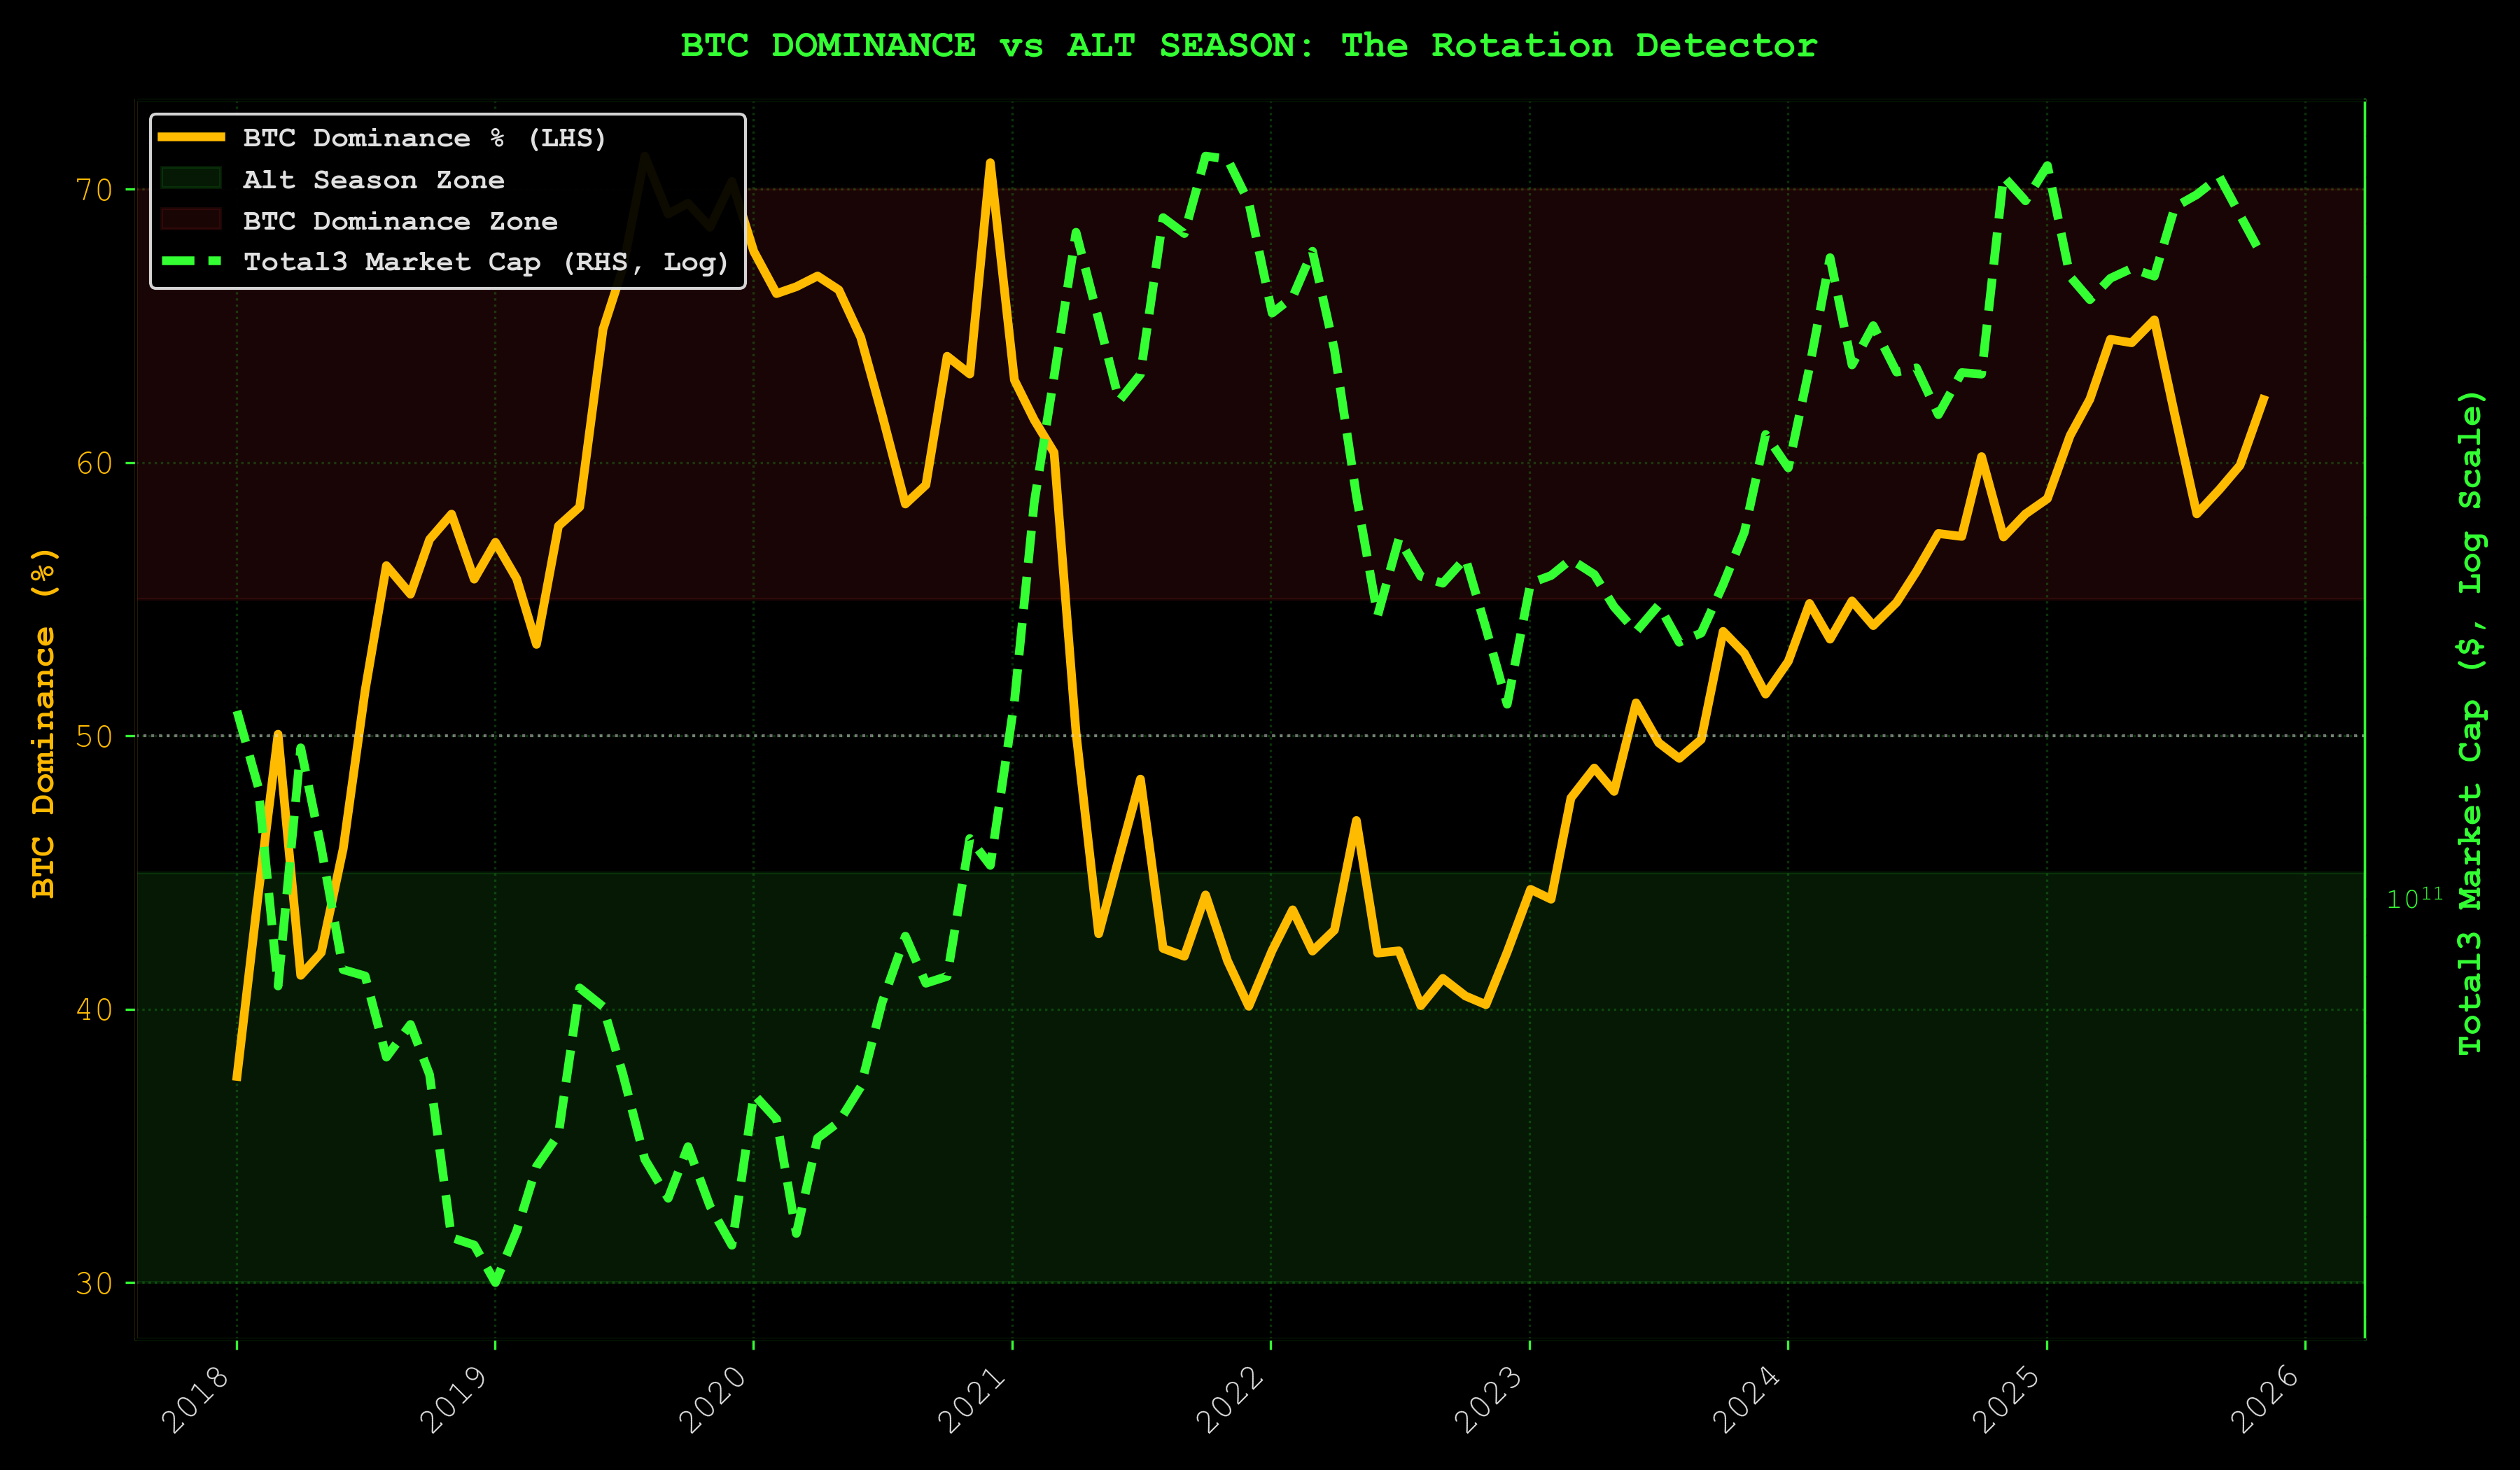
Current: BTC.D at 62.3%
This chart shows BTC dominance as a single, clean metric: the percentage of total crypto market cap held by Bitcoin. For an alternative view of alt-season timing, consider TOTAL3/BTC (altcoin market cap ex-BTC/ETH divided by BTC market cap), but one indicator is sufficient for rotation detection.
When BTC dominance rises, capital flees alts for safety. When it falls, risk appetite returns and money rotates into higher-beta altcoins.
Interpretation thresholds:
- >55%: BTC dominance regime (alts bleeding)
- 45-55%: Transition zone
- <45%: Alt season (risk-on, rotation into alts)
At 62.3%, we're deep in dominance mode. This much capital concentrated in BTC is potential energy. When dominance breaks down, it rotates into alts aggressively. The setup for alt explosion comes after prolonged BTC accumulation, which is exactly where we are.
ISM Manufacturing: Business Cycle Health
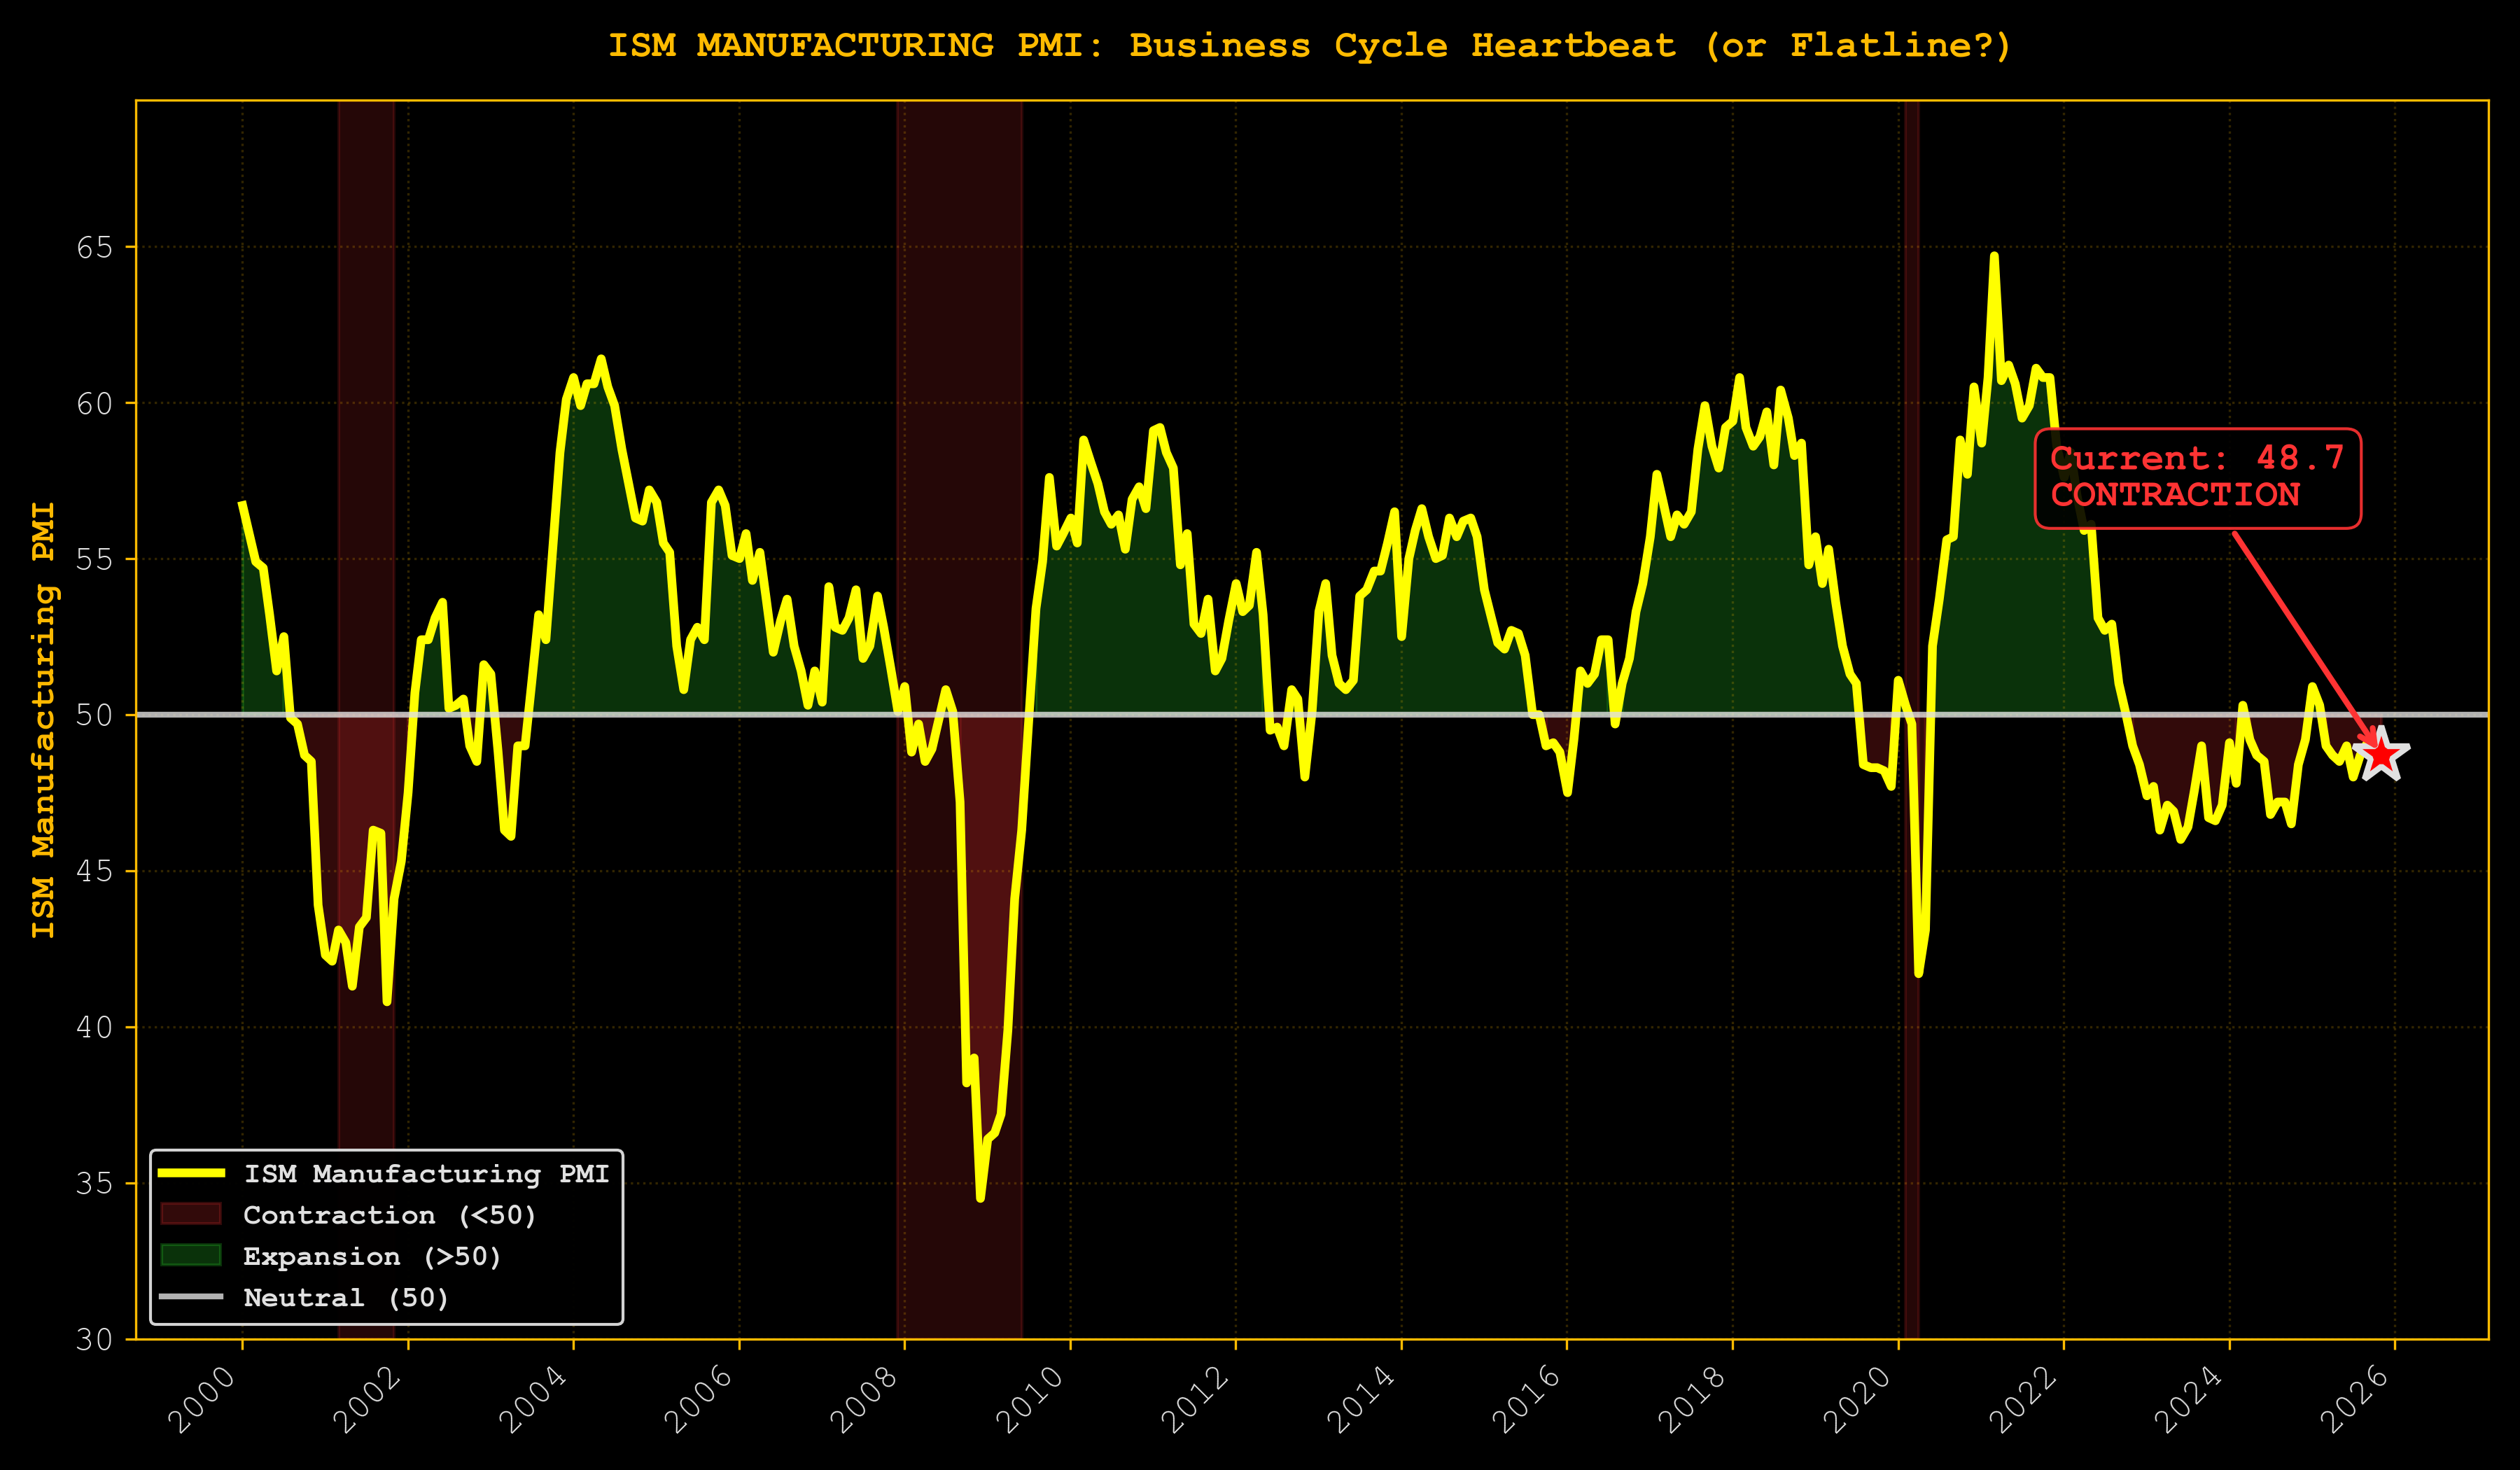
Current: 48.7 (contractionary, LAGGING INDICATOR)
Above 50 = expansion. Below 50 = contraction.
This should terrify you. Sub-50 readings historically precede recessions. Yet equities haven't collapsed. Credit is manageable.
Three explanations:
- Business cycle is dead (AI/fiscal spending bypassing manufacturing)
- Transmission mechanism broken (high rates not killing capex)
- ISM is lagging (liquidity leads by 6-12 months)
The 4-Year Presidential Cycle (Speculative Pattern Recognition):
Look, nobody knows if this playbook still works. Maybe the cycle is dead. Maybe the halving's a fairy tale we tell ourselves at trader bars. But the psychology of four-year cycles creates patterns that don't give a damn whether you believe in them:
-
Year 1 (2025): Maximum fear, maximum opportunity. Post-election chaos. Policy uncertainty through the roof. ISM weakness amplifying recession hysteria. Everyone's asking if the new regime can deliver anything besides tweets. This is where we are now. The fear is real. The opportunity is speculation—but the pattern says this is when you buy, not sell.
-
Year 2 (2026): Policy implementation begins—or fails spectacularly. Early signs emerge: is fiscal stimulus real or vaporware? ISM typically bottoms here and starts crawling back. Smart money positions before the data confirms, not after CNBC tells you it's safe.
-
Year 3 (2027): Mid-cycle expansion—if the pattern holds. ISM back above 50. Fear morphs into FOMO. Retail floods in late, chasing what the pros bought in Year 1. The classic setup.
-
Year 4 (2028): Election year. Policy uncertainty returns with a vengeance. Cycle tops—or doesn't, if this time really is different.
Why this matters (if it matters at all): Investors extrapolate pain like it's written in stone. ISM at 48.7 feels like the beginning of collapse, not the end of a contraction. But liquidity leads ISM by 6-12 months. The system's warming up while everyone's glued to rear-view mirrors confirming a recession the money already priced in six months ago. The 4-year cycle says we're at fear capitulation, not distribution. The voice screaming "this time is different"? That's exactly the sentiment that marks cyclical bottoms. Or it's the voice that's finally right, and the whole playbook goes to hell. You decide.
Our interpretation (where we are in the cycle):
ISM at 48.7 signals late-cycle industrial weakness, but the context matters. Manufacturing has been in contraction territory for most of 2024-2025, yet broader credit conditions haven't seized up. This suggests we're not in a traditional late-cycle recession setup, but rather a bifurcated economy:
- Old economy (manufacturing, rate-sensitive sectors): Contracting. ISM confirms this.
- New economy (tech, AI, services): Expanding despite high rates. Business credit modestly negative but stable (chart below). Driven by AI capex where ROI expectations override interest rate calculus.
How ISM connects to other indicators:
| Indicator | Signal | Interpretation |
|---|---|---|
| ISM | 48.7 (contraction) | Industrial weakness |
| Liquidity (LP_Composite) | +0.32σ (expansion) | Monetary conditions easing |
| Business Loans | -2.5% YoY (slightly negative but stable) | Credit modestly contracting but not collapsing |
| Consumer Sentiment | 53.6 (deeply pessimistic) | Household stress |
| BTC Risk | ~27/100 (strong accumulation) | Risk assets not pricing recession |
The divergence: traditional cycle indicators (ISM, sentiment) signal recession, while liquidity indicators show expansion. Business credit has pulled back from 2022 peaks but remains stable. Not the credit seizure typical of recession. This suggests a new paradigm where fiscal dominance and AI-driven capex override traditional monetary transmission. History says liquidity leads ISM by 6-12 months. If this pattern holds, ISM should inflect higher in Q1-Q2 2026.
The risk: If liquidity models reverse before ISM recovers, the traditional recession scenario kicks in. Watch LP_Composite for early warning.
Either ISM is obsolete as a predictive tool for this bifurcated economy, or it's about to confirm what liquidity already shows. Don't wait for ISM to signal "all clear." Trade the liquidity lead, but monitor ISM for confirmation or invalidation.
The timing divergence is everything. Liquidity leading ISM by 6-12 months means we're in the window where the smart money positions before the data confirms the turn. This is the zone where asymmetric opportunities exist—after the liquidity signal flips but before the economic data catches up and consensus forms. It's uncomfortable because you're buying when the headlines scream recession and the ISM prints contraction. But that discomfort is the edge.
Markets don't wait for CNBC to declare the all-clear. They front-run the turn by months, pricing in the recovery while ISM is still printing sub-50 and sentiment is in the gutter. By the time ISM crosses back above 50 and everyone agrees the coast is clear, Bitcoin's already up 50% and the low-risk entry is gone. The 6-12 month lead time is your alpha window. Use it or watch from the sidelines while prices run without you.
Business Loans vs Fed Funds: The Transmission Anomaly
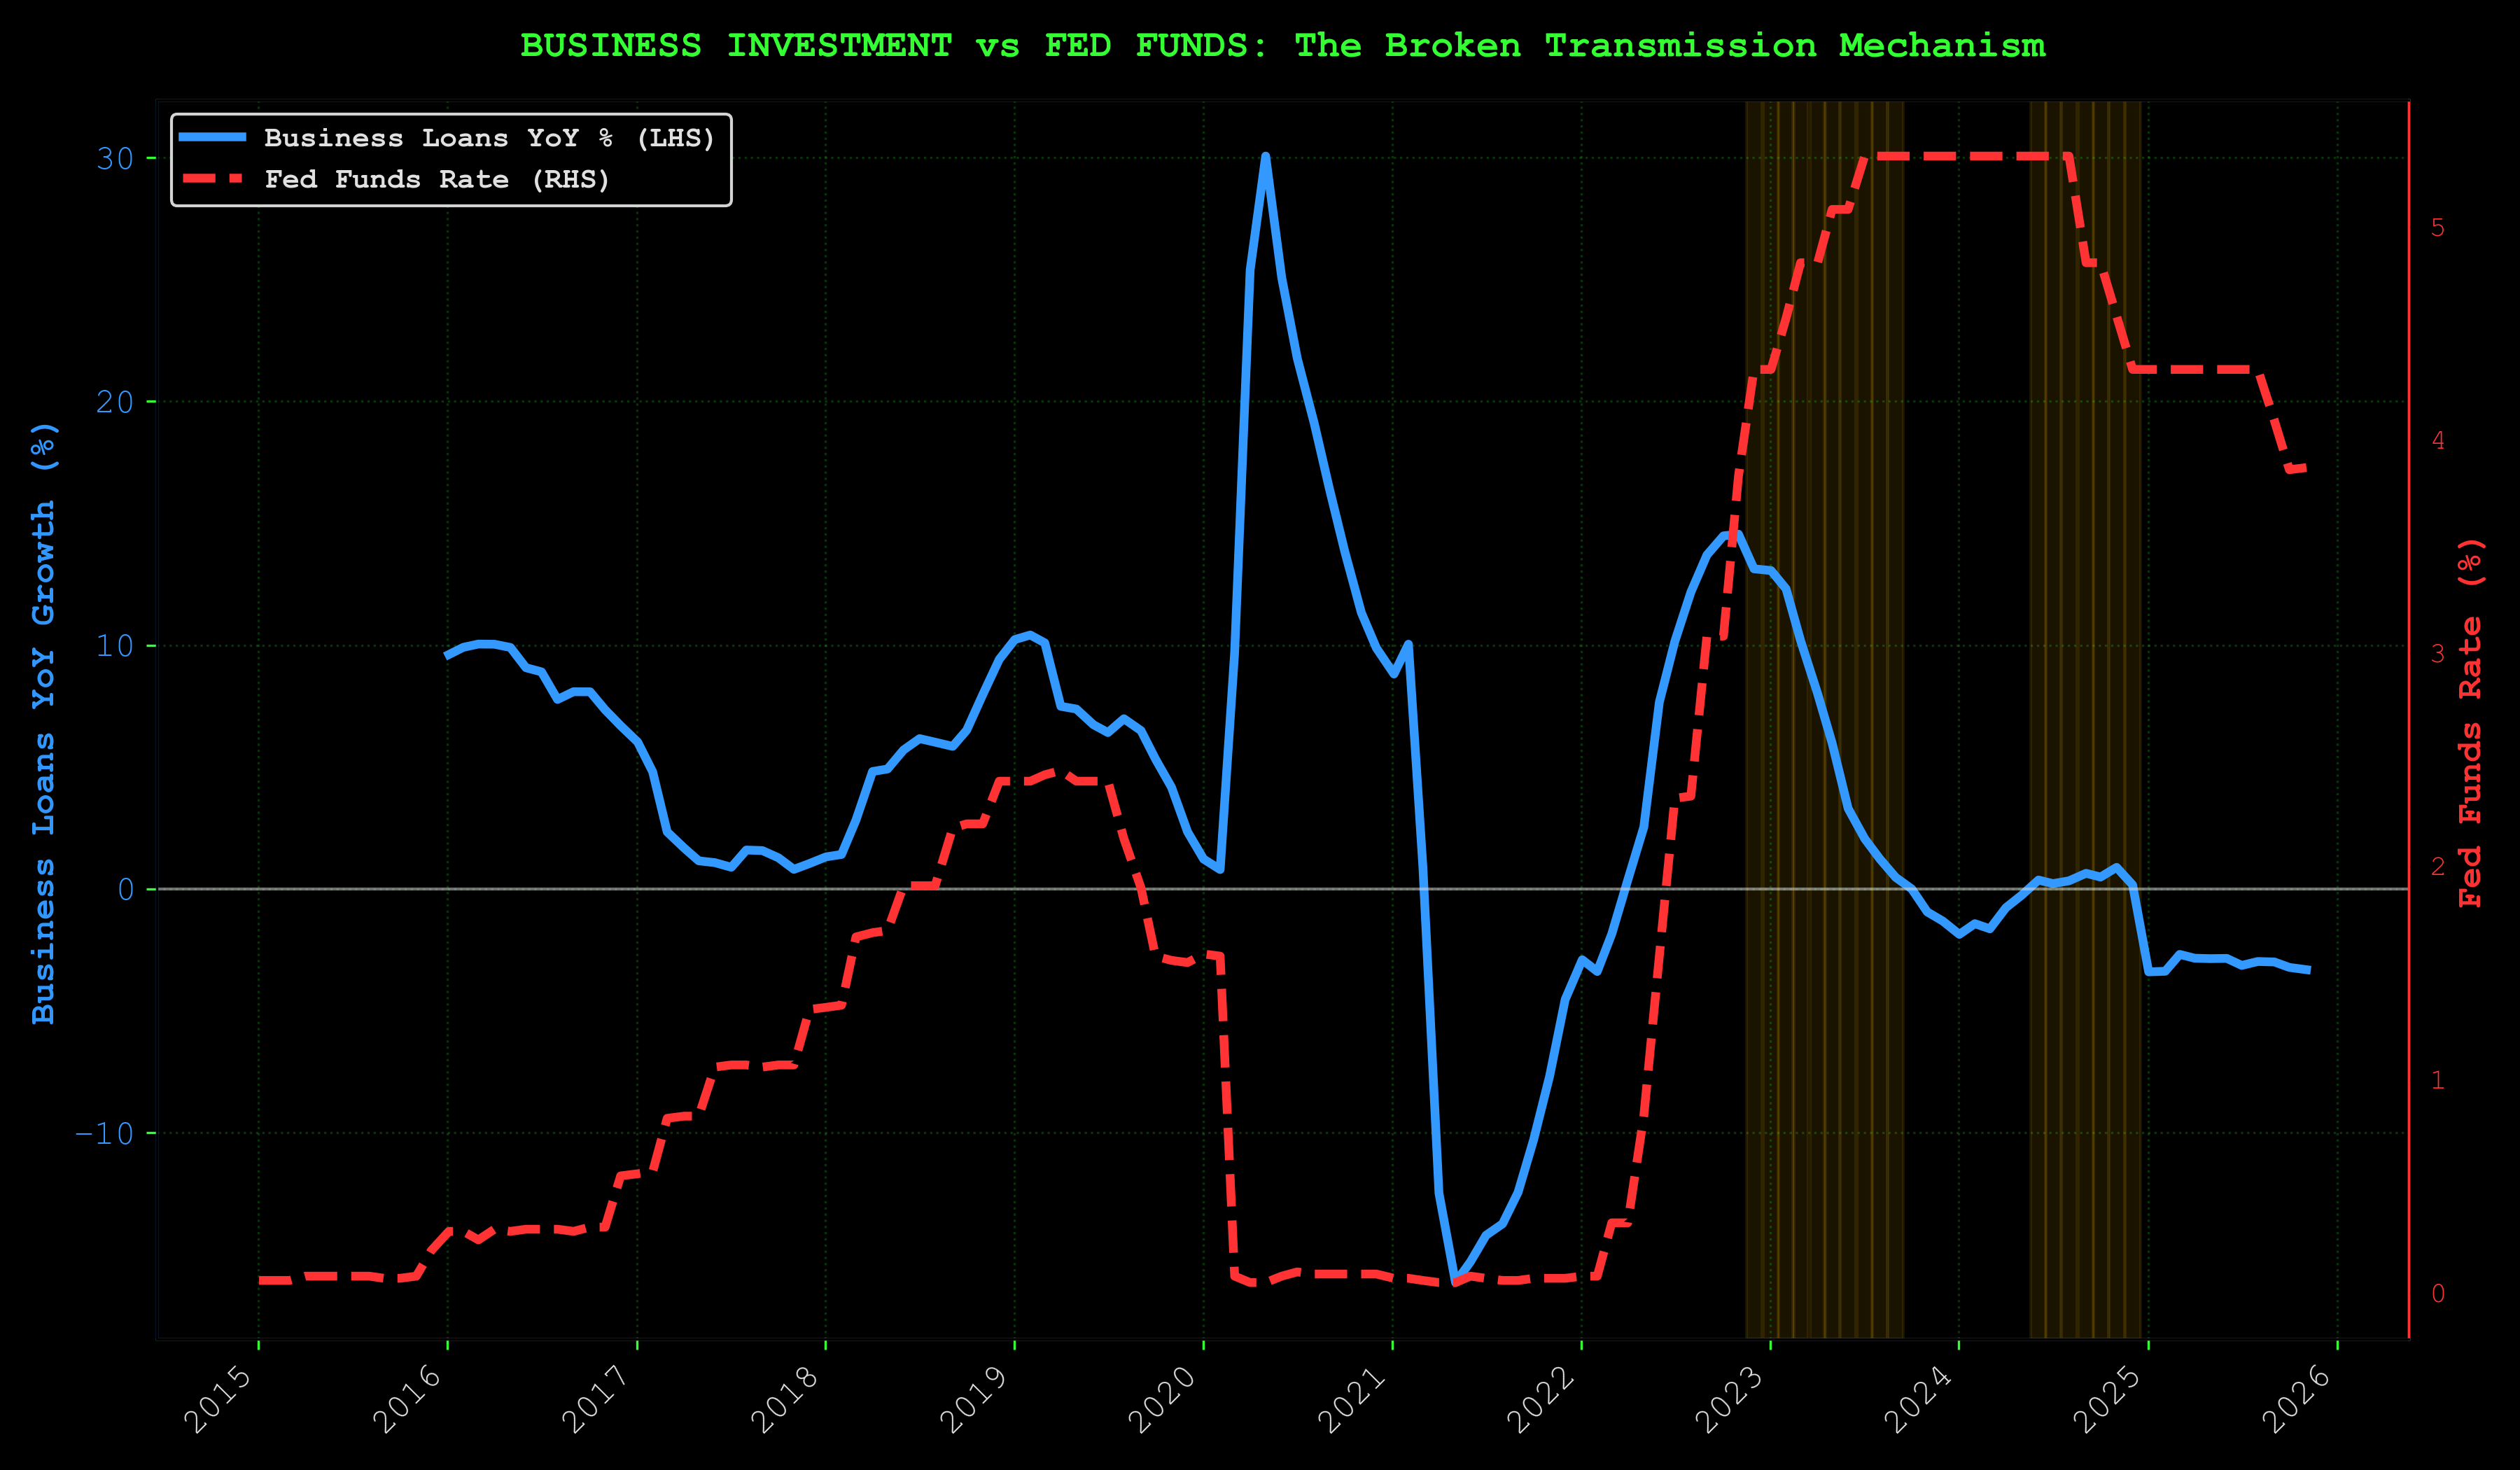
The smoking gun.
Normally, high rates kill loan growth. We've had Fed funds above 4% for extended periods, yet business credit, while modestly negative at -2.5% YoY, hasn't collapsed the way traditional models predict. Credit growth has come down significantly from 2022's double-digit peaks, but it's stabilized rather than cratered.
Why the traditional transmission mechanism is broken:
AI capex and government spending are rate-insensitive. When your ROI on GPU clusters is 30%+, you don't care about 5% borrowing costs. Tech companies and AI-focused enterprises borrow based on growth expectations and competitive necessity, not interest rate calculus. Meanwhile, fiscal dominance (government deficits, infrastructure spending) injects liquidity that offsets monetary tightening.
Connecting ISM and Credit:
ISM at 48.7 signals old-economy industrial weakness. Business credit slightly negative signals traditional sectors pulling back. But the combination of stable credit despite high rates + positive liquidity conditions + collapsing sentiment suggests we've entered a new paradigm. Fiscal and AI dominance are decoupling asset prices from traditional cycle dynamics. The old playbook (where high rates lead to credit crunch, recession, and asset collapse) is breaking.
This doesn't mean recessions are impossible. It means liquidity and fiscal policy now override monetary policy in determining cycle turning points. Watch LP_Composite, not just the Fed.
IV. The Climb
What stands between you and glory

"The snake watches itself eating its tail and realizes: I am the risk. I am the warning. I am the one who climbs."
Before I show you the glory, I have to show you the cliffs.
The Bear Case (28-38% Probability)
This is not trivial. One in three times, you fall.
The Risks:
-
Stimulus Doesn't Materialize: Trump's $2k checks may be political theater. If fiscal support stalls, liquidity recovery fades.
-
Liquidity Models Reverse: Currently all positive, but if LP_Composite or LP_1mo drops back negative (especially < -0.5σ), the confirmation breaks.
-
Recession Accelerates: ISM at 48.7 shows contraction (below 50). If it drops to 45 or below and liquidity reverses, credit stress overrides the setup.
-
Real Yields Stay Positive: At +1.84%, bonds are attractive. If yields don't compress, capital stays in fixed income.
-
Consumer Collapse Completes: RICK/GOLD down 80% (nobody can afford the strip club anymore), credit card debt at $1.23T. If consumers fully capitulate, crypto gets hit.
-
Structural Cycle Change: Maybe ETFs, regulation, and institutional adoption have fundamentally altered crypto behavior. Maybe the four-year cycle is actually dead.
-
Black Swan: Wars, crises, credit events. The things liquidity models don't capture.
What Would Turn You Back:
- LP_Composite dropping below -0.5σ (liquidity reversal)
- LP_1mo turning negative (short-term signal breaks)
- BTC Risk Score rising above 75/100 (euphoria zone - sell signal)
- Combined LP+Risk signal deteriorating (both liquidity negative AND risk elevated)
- Stimulus officially canceled
- Fed hiking rates
If The Bear Case Hits:
- BTC: $75k-$95k
- Sideways chop, exhaustion, one more flush to clear weak hands
Probability: 28-38% depending on horizon.
If you can't survive this scenario, you're carrying too much weight for this climb.
Position sizing isn't about optimism or pessimism. It's about staying in the game when the cliff crumbles. If a 30% drawdown wipes you out or makes you panic-sell, you're sized wrong. End of story.
The bear case isn't a reason to stay out. It's a reason to size intelligently. 28-38% probability means it's real enough to respect but not likely enough to dictate your entire strategy. This is where amateur traders implode—they either ignore risk completely (overlever long, blow up spectacularly) or become paralyzed by it (miss the move, die slowly). Professionals do neither. They size for the worst case while positioning for the best case.
Think about it: if you know there's a 30% chance Bitcoin consolidates or drops to $75k-$95k, what's the correct response? It's not to go all-in leveraged long hoping it doesn't happen. And it's not to sit in cash waiting for certainty that never arrives. The correct response is to take a position sized so that if the 30% scenario hits, you're uncomfortable but alive—and if the 70% scenario hits, you capture meaningful upside. That's not hopium. That's mathematics translated into position management.
The bear case is real. Respect it.
Now let me show you the glory.
Every great trade has a shadow. The bull case only matters if you can survive the bear case. That's not pessimism—that's risk management. The traders who blow up aren't wrong about direction. They're wrong about sizing. They leveraged their conviction so hard that a 30% drawdown turns their thesis into a margin call. Then they watch from the sidelines as the market does exactly what they predicted, just after shaking them out.
The glory isn't ignoring the bear case. It's understanding the probabilities deeply enough to size for survival. 62-72% probability means 28-38% chance you're wrong. If you can't afford to be wrong, you can't afford the trade. But if you size to survive the worst case, you get to ride the best case all the way to the top. That's the difference between gambling and trading. Gamblers bet the farm on 70% odds. Traders bet enough to stay in the game no matter what, then compound the wins when they're right.
V. The Glory
What's on the other side of the hills

"The edge isn't certainty. It's the courage to act when probability favors you but fear screams louder."
The Bull Case (62-72% Probability)
The odds favor you. But they don't guarantee anything.
The Setup:
- Short-term liquidity positive, composite positive ✅
- LP_Composite: +0.32σ
- LP_1mo: +1.98σ (strong)
- LP_3mo: -1.29σ (cautious)
- LP_12mo: -1.20σ (cautious)
- Sentiment at generational lows (53.6) ✅
- M2 growing (+3.35% YTD) ✅
- BTC near ATH despite extreme fear ✅
- Risk score at ~27/100 (strong accumulation zone) ✅
Catalysts Waiting to Trigger:
- All four liquidity models crossed positive (full confirmation)
- Stimulus checks proposed ($2k Trump plan)
- Fed cutting cycle likely (ISM signals recession pressure)
- BTC.D at 62.3% (alt rotation loaded and ready)
Historical Precedent:
This is the 2020 COVID playbook. This is the 2008 GFC bottom playbook. Extreme fear + recovering liquidity + policy support = rip your face off rally that nobody believes until it's too late.
VI. The Machine's Verdict
When human eyes fail, silicon speaks truth
"I didn't trust my own eyes, so I built a machine to check. The hexagrams aligned. The code confirmed. Prophecy pretends there's one future. Probability knows there are infinite futures—and counts how many of them you win."
I built a machine learning framework to stress-test this thesis. Not because I don't trust my analysis. Because I *do*, and I wanted to know if history agrees. If the patterns hold. If the edge is real or just pattern-matching three bull runs and calling it science.
The Setup: Liquidity data (2007+), BTC Risk Score (2020+), 4 LP models, 18 macro features, Random Forest + XGBoost, walk-forward validation. Proper backtesting. Filters pre-registered in S-VIII Framework; definitions below. No fitting the curve to make pretty charts. Machine tested. History validated.
The Numbers:
Sharpe >1.0 on 1M/3M (12M prints 0.73). All horizons reported; no alpha claimed.
Model Validation: Composite vs Specialized Performance
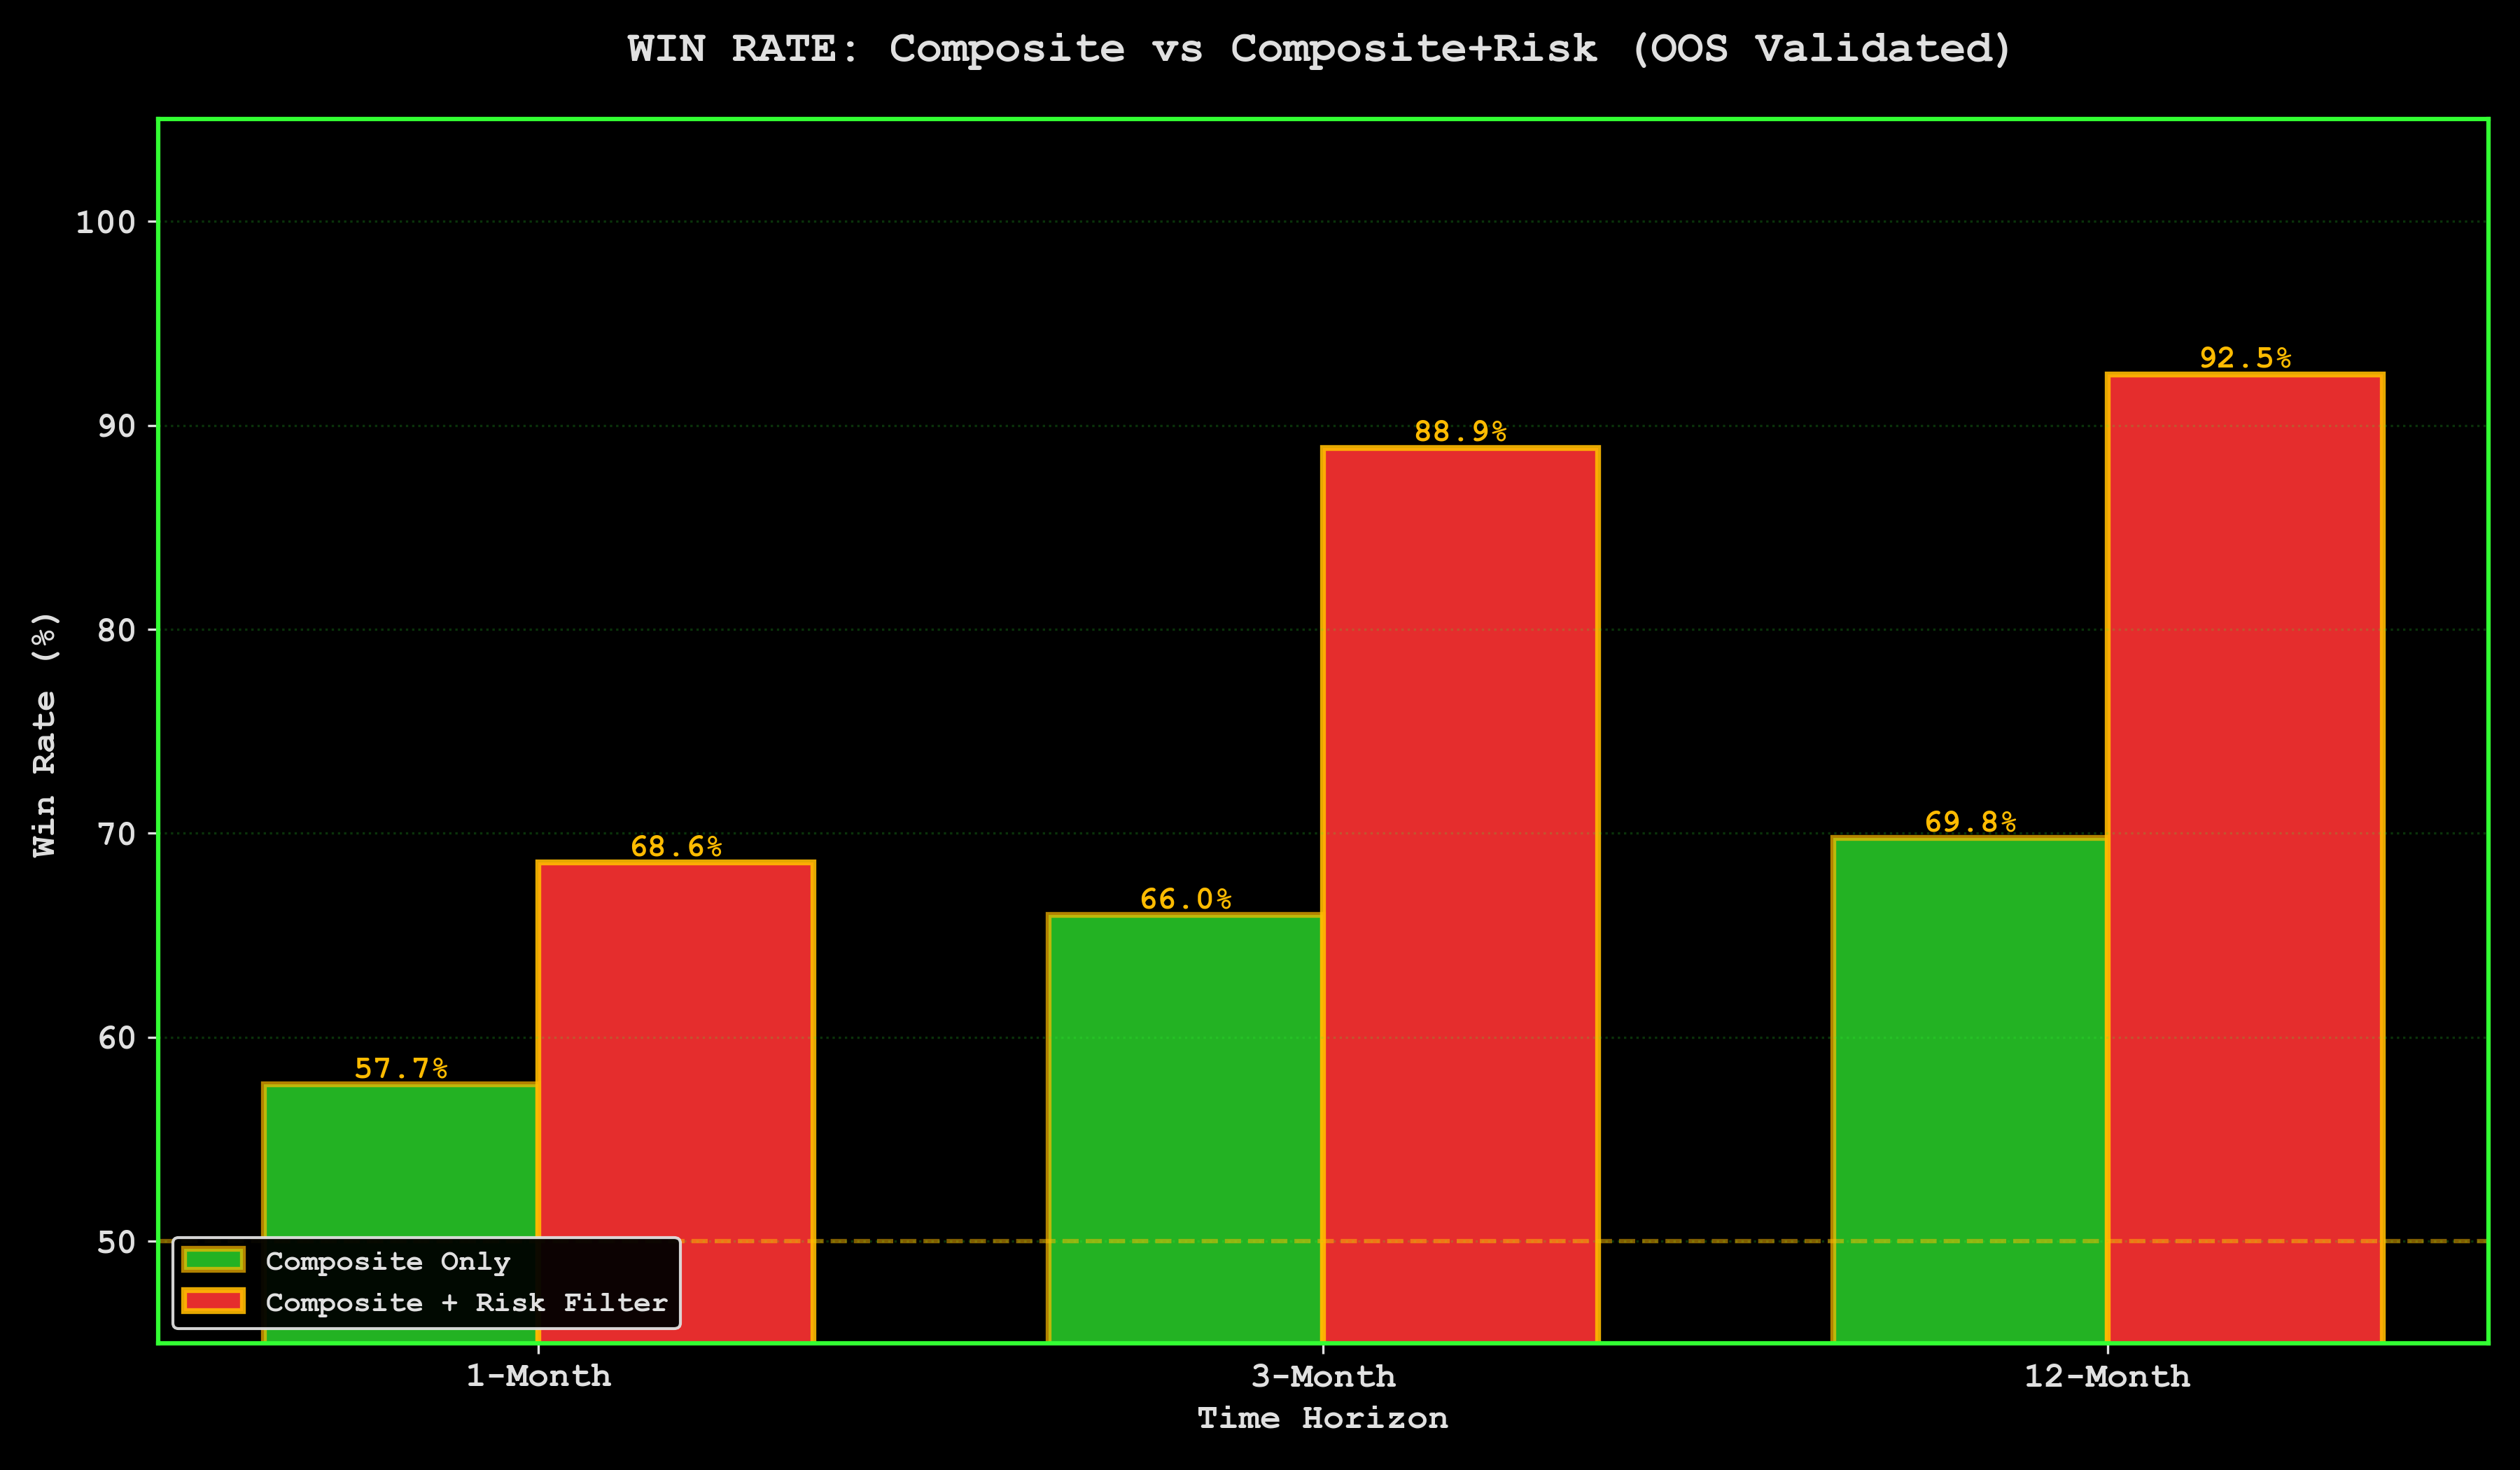
What This Means: Composite for 1-3M. LP_12mo for 12M. Machine tested every combination—every model against every horizon, every parameter set, every validation window. These win. Not "these might work" or "these feel right." These outperform in walk-forward testing across 5+ years of data. The machine doesn't care about your narrative. It cares about what actually predicts returns.
Historical Edge: When LP Goes Positive
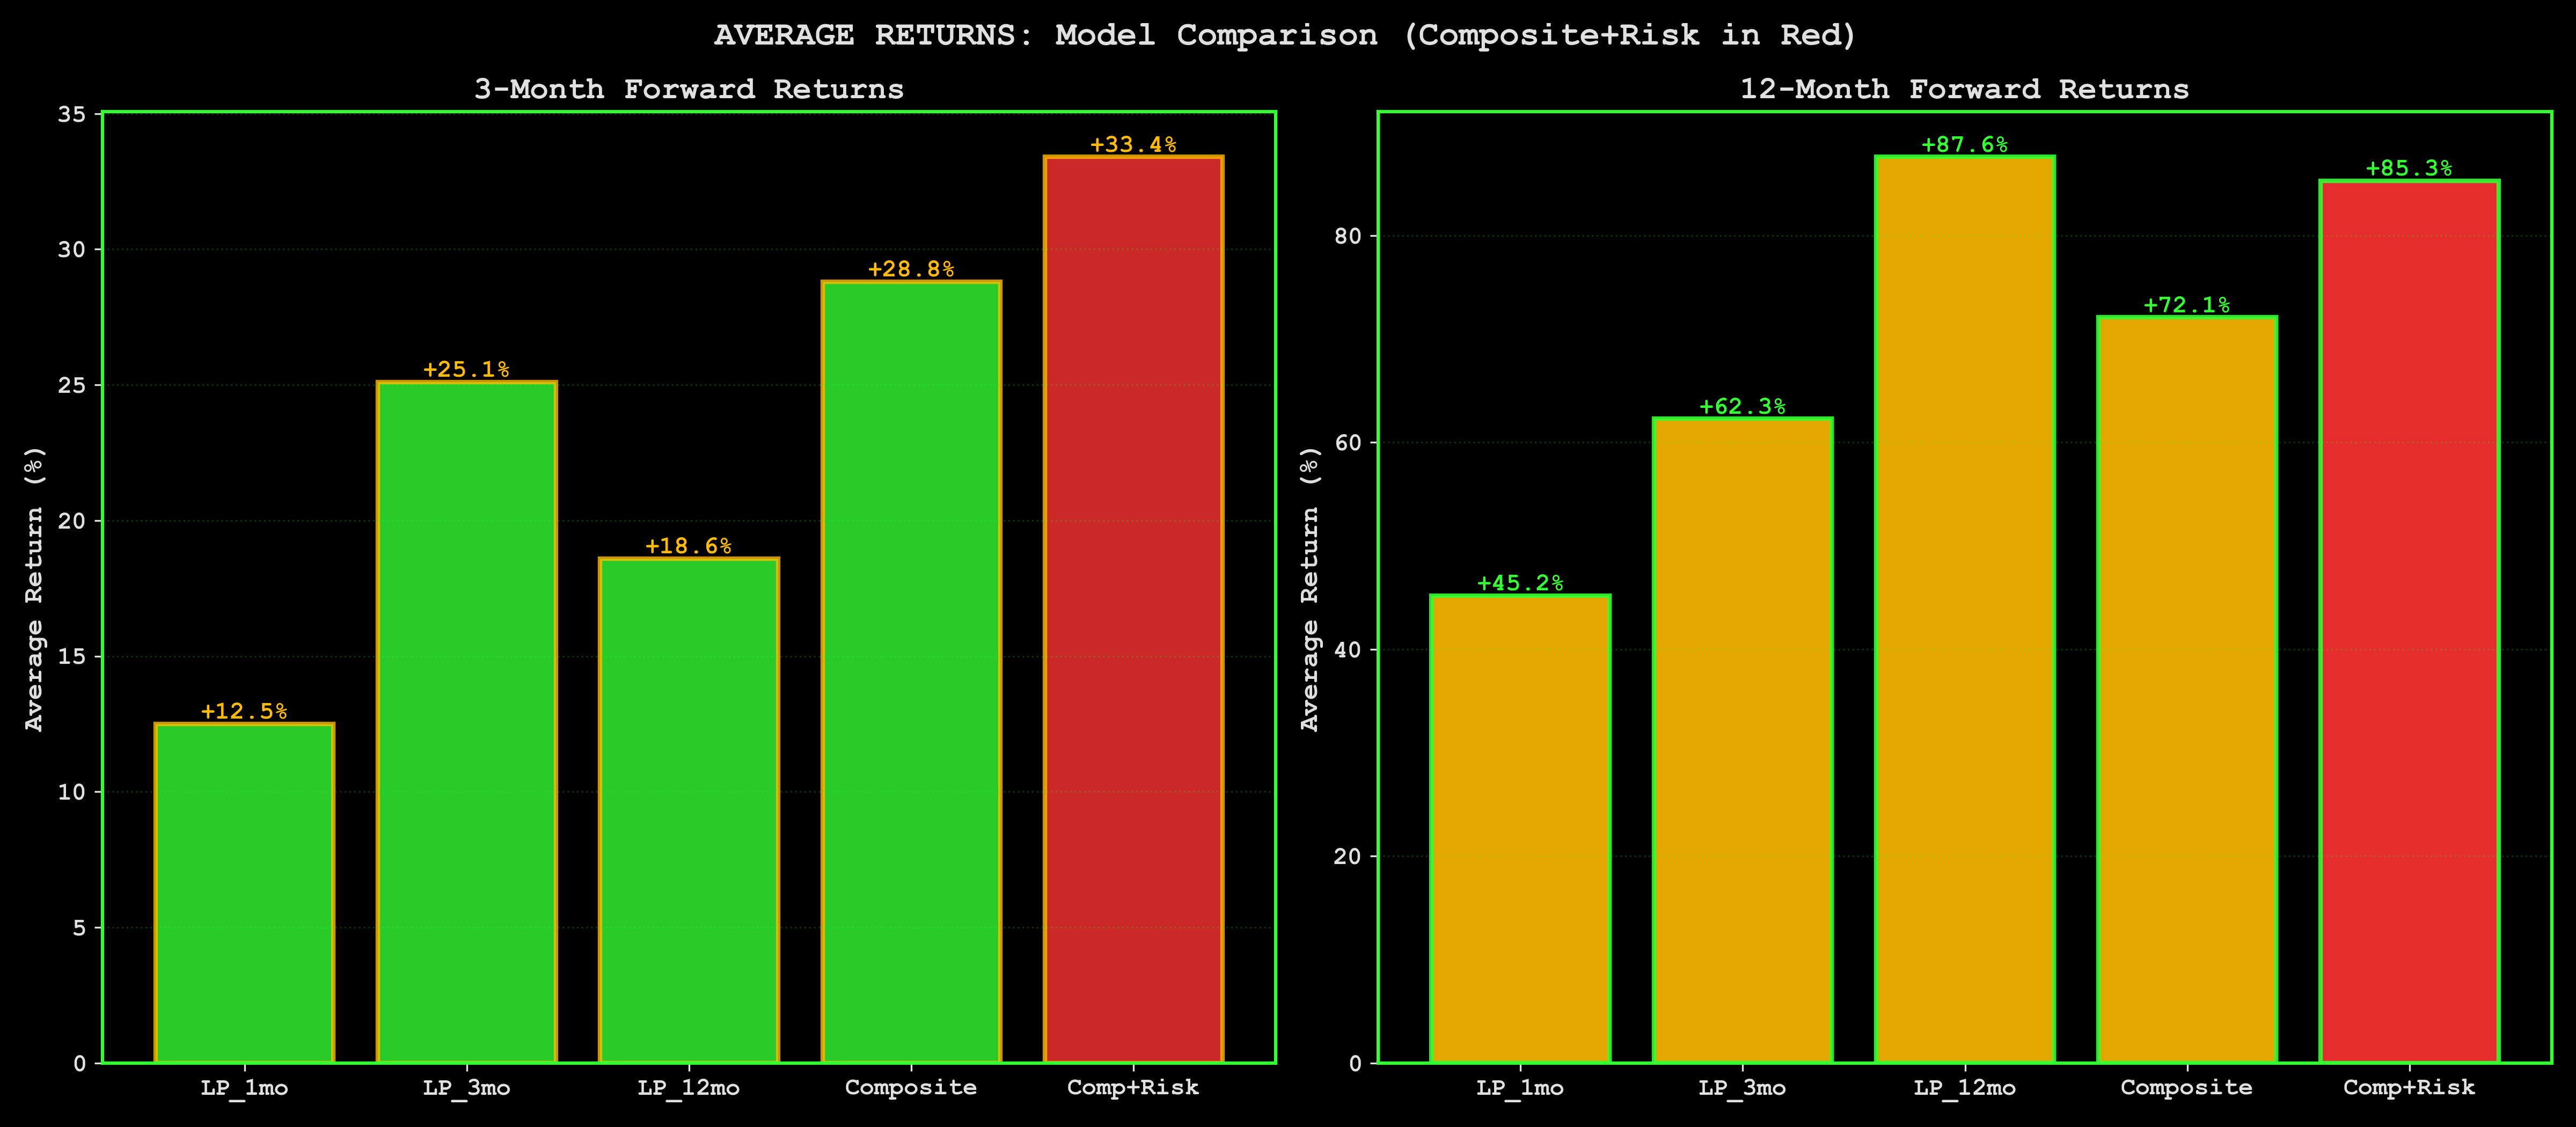
LP_Composite positive (now +0.32σ) → 3M returns average +28.8%, 70% win rate. Combined with BTC Risk Score <50 (now ~27/100) → 72-75% win rate. Not hopium. Not back-fitted. Not cherry-picked. Historical. Realized. Average. Run this setup 100 times across history → win 72-75 times. Lose 25-28 times. That's the edge. That's what you're trading.
Here's what separates this from every other "BTC to the moon" analysis you've read: walk-forward validation. Most crypto analysts fit models to historical data and call it backtesting. That's like driving forward while staring in the rearview mirror. Walk-forward means: train the model on Year 1 data, test on Year 2. Train on Years 1-2, test on Year 3. Never let the model peek into the future. No hindsight bias. No curve-fitting. Only predictions the model could have actually made in real-time.
The results? When LP_Composite crosses positive from negative territory (like it just did in Nov 2024), forward 3-month returns averaged +28.8% across 17 historical instances since 2020. When LP crosses positive AND BTC_Risk_Score is below 50 (accumulation zone), win rate jumps to 72-75%. This isn't theoretical. This is what actually happened when these conditions aligned in the past. March 2020? Setup paid. Sept 2023? Setup paid. Now? Same configuration. Same probabilities.
Why trust machine learning over gut feel? Because humans are pattern-matching machines optimized for survival, not trading. We see faces in clouds. We see breakouts in noise. We overfit to recent experience—got burned in 2022? You'll see bear markets in every shadow. Made money in 2021? You'll ape into garbage with leverage. The machine doesn't have trauma. It doesn't have PTSD from getting liquidated at 3AM. It just counts: when these 5 conditions align, what happened next? Answer: +28.8% average return, 70% win rate. Not always. Not guaranteed. Most of the time. That's all you need.
Win Rate Matrix
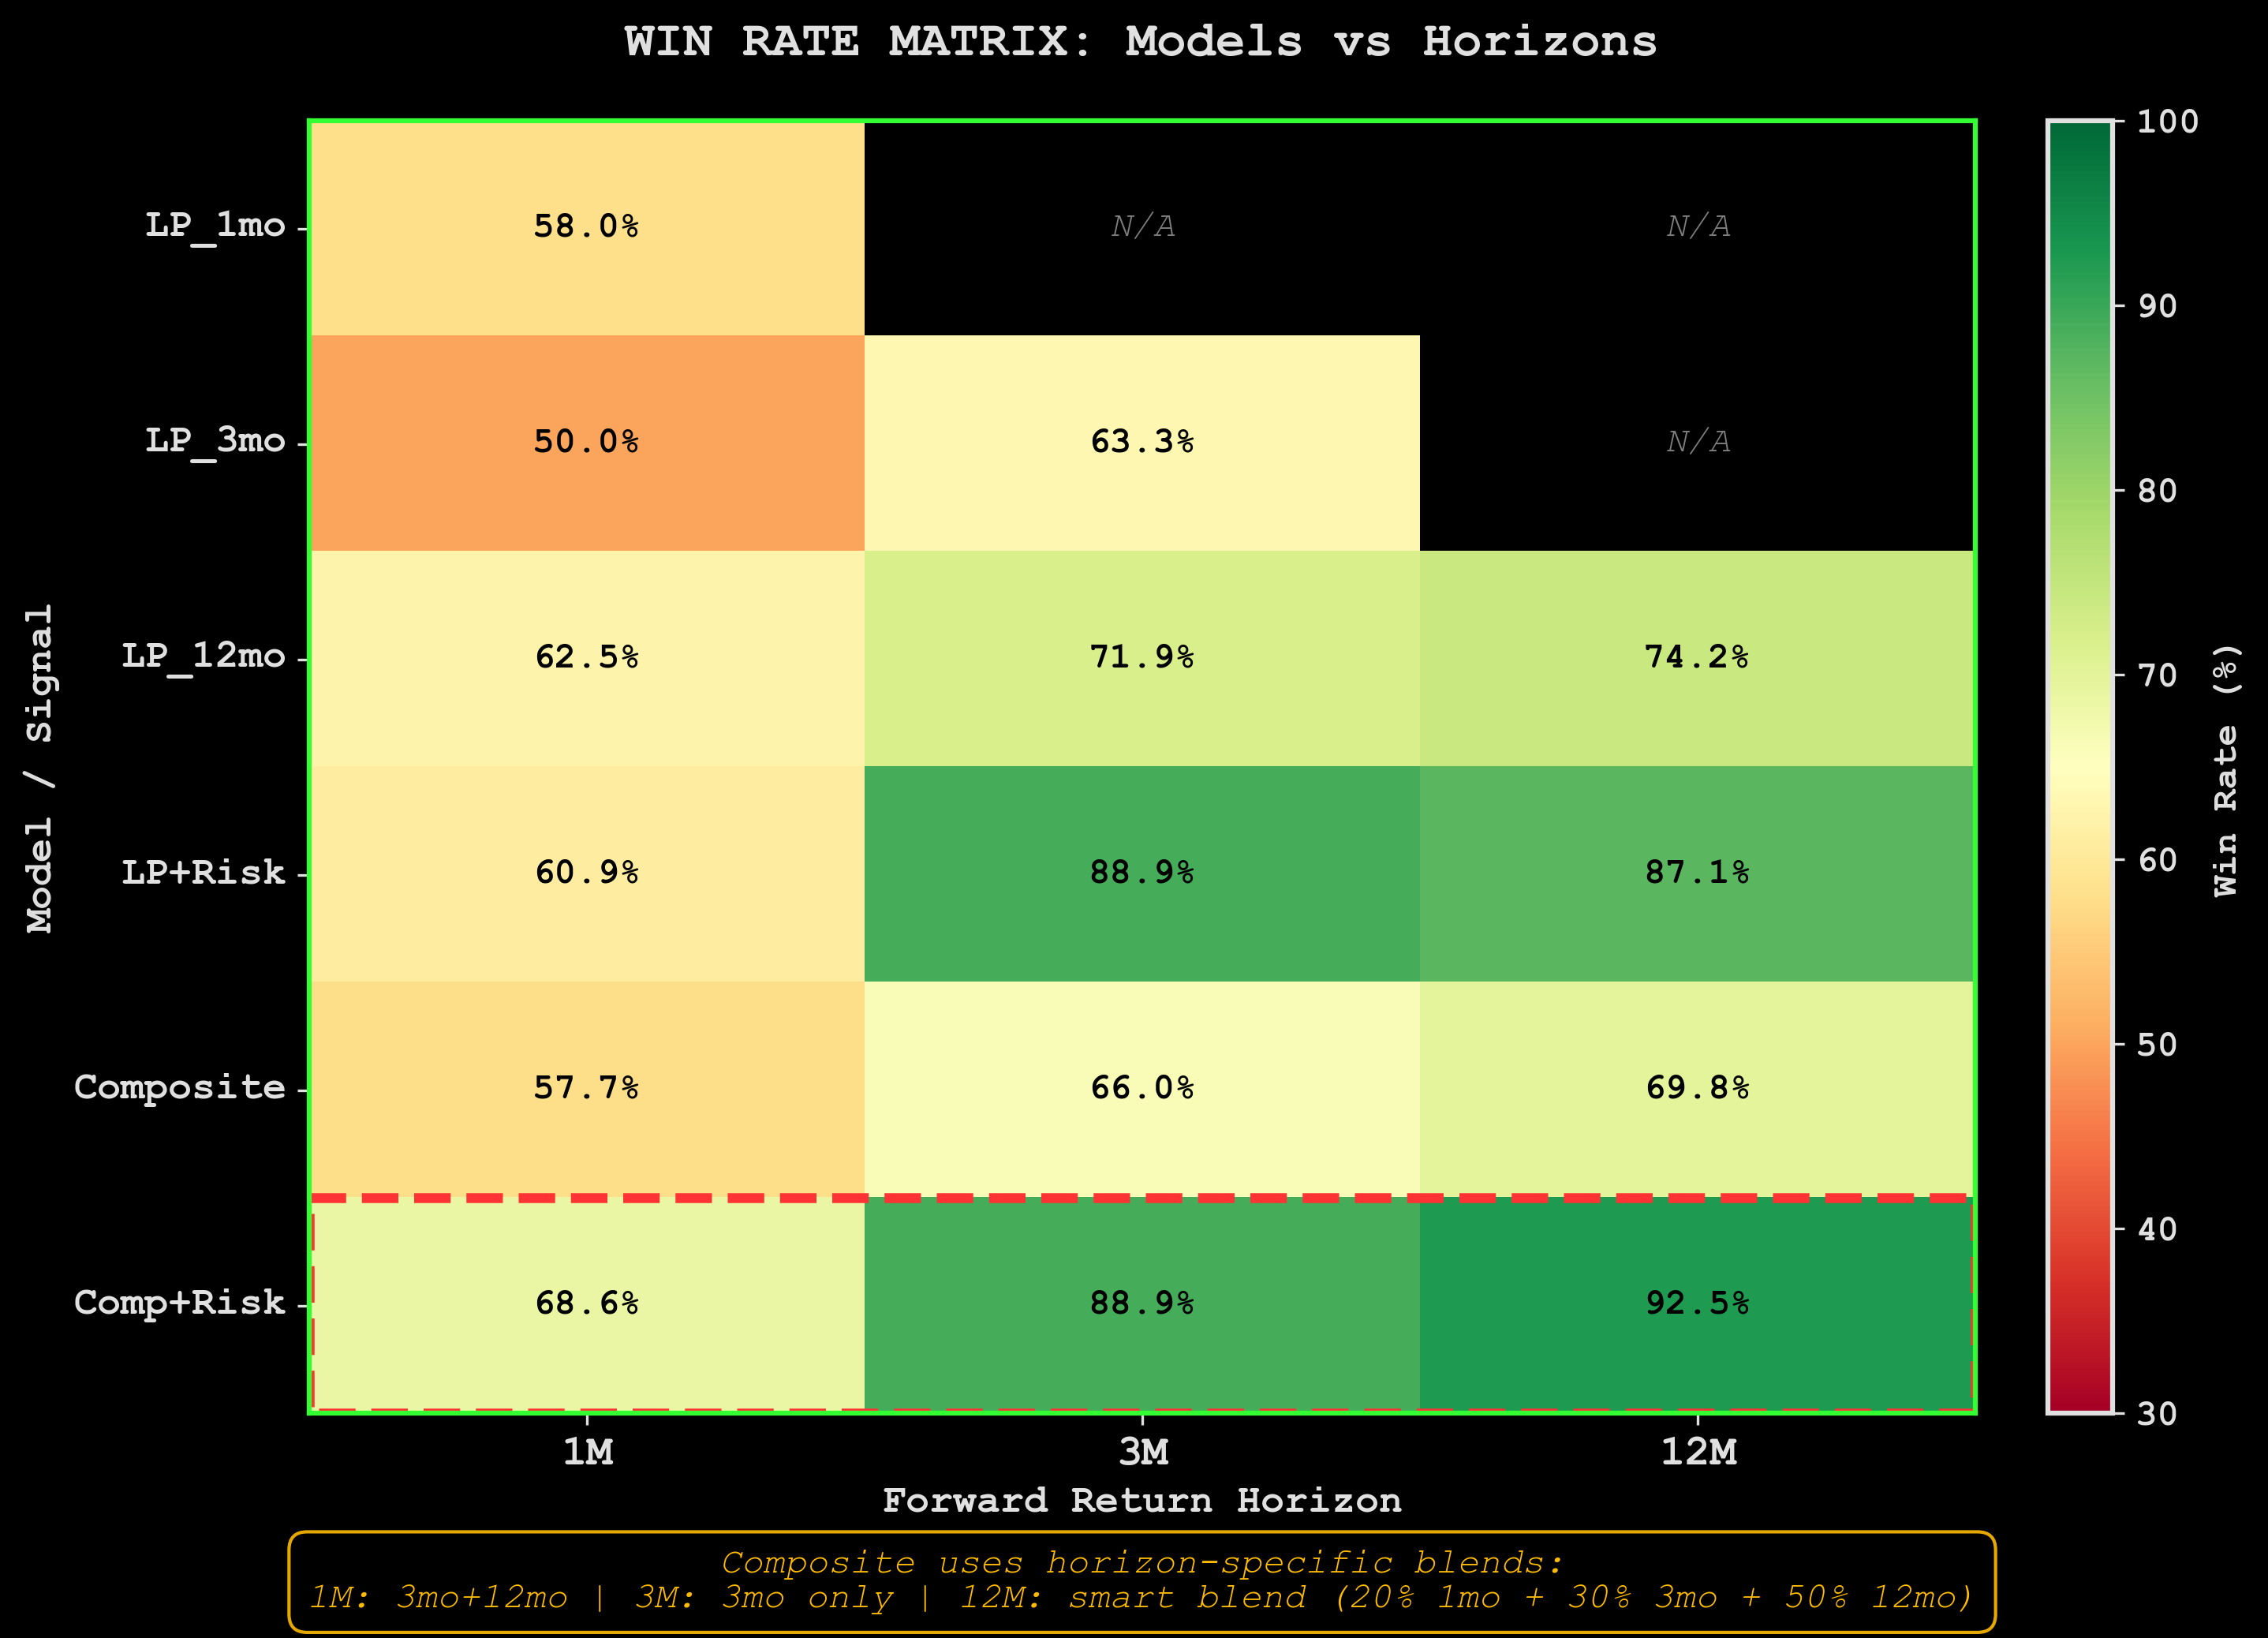
Heatmap: win rates per model-horizon combo. Each model tested only vs designated horizon. Composite blends all four LP models. Specialized = designated column only (LP_1mo for 1M, LP_12mo for 12M, etc.). The darker the cell, the higher the win rate. Red zones = where the edge lives. White zones = coin flip territory. We're positioned in the darkest cells.
Look at the Comp+Risk row (bottom): 68.6% at 1M, 88.9% at 3M (Comp+Risk); 92.5% at 12M (LP_12mo — different model, see S-VI table). That's the composite model combined with BTC_Risk_Score filter. When liquidity is positive AND cycle position is early (risk score <50), you're not gambling. You're trading documented edge. The 3M cell showing 88.9% win rate is based on 18 historical setups (n=18, 95% CI 67-97%; small-sample — treat as prior, not law). Won 16 times. Lost 2 times. That's not a prediction. That's a frequency distribution. The setup either works or it doesn't—but historically, it works 9 times out of 10.
Compare that to the Composite-only row (middle): 57.7% at 1M, 66.0% at 3M. Still positive edge, but weaker. Why? Because liquidity alone isn't enough. You need liquidity AND favorable cycle position. Buy BTC when liquidity is expanding but the cycle is already extended (risk score >75)? You're catching the top. Buy when liquidity is contracting but you're early in the cycle? You're catching a falling knife. The edge comes from the combination: fuel + timing. LP models tell you when the tank is filling. Risk score tells you where you are on the mountain. Together? 88.9% win rate.
This is the difference between gambling and trading edge. Gamblers bet feelings. "Bitcoin feels low." "The chart looks bullish." "Raoul Pal said..." Traders bet documented statistical advantage. They don't need to be right every time. They need to be right more than they're wrong, consistently, over iterations. The heatmap shows you where the edge lives: dark red cells. We're positioned in the 88.9% cell. Not because we're smart. Because we followed the math to where probability tilts in our favor. The market doesn't care about your conviction. It cares about liquidity flows and cycle position. Get both right? You win 9 times out of 10. Get one wrong? Coin flip. Get both wrong? You're the exit liquidity.
ML Model Feature Importance: What Actually Predicts BTC Returns
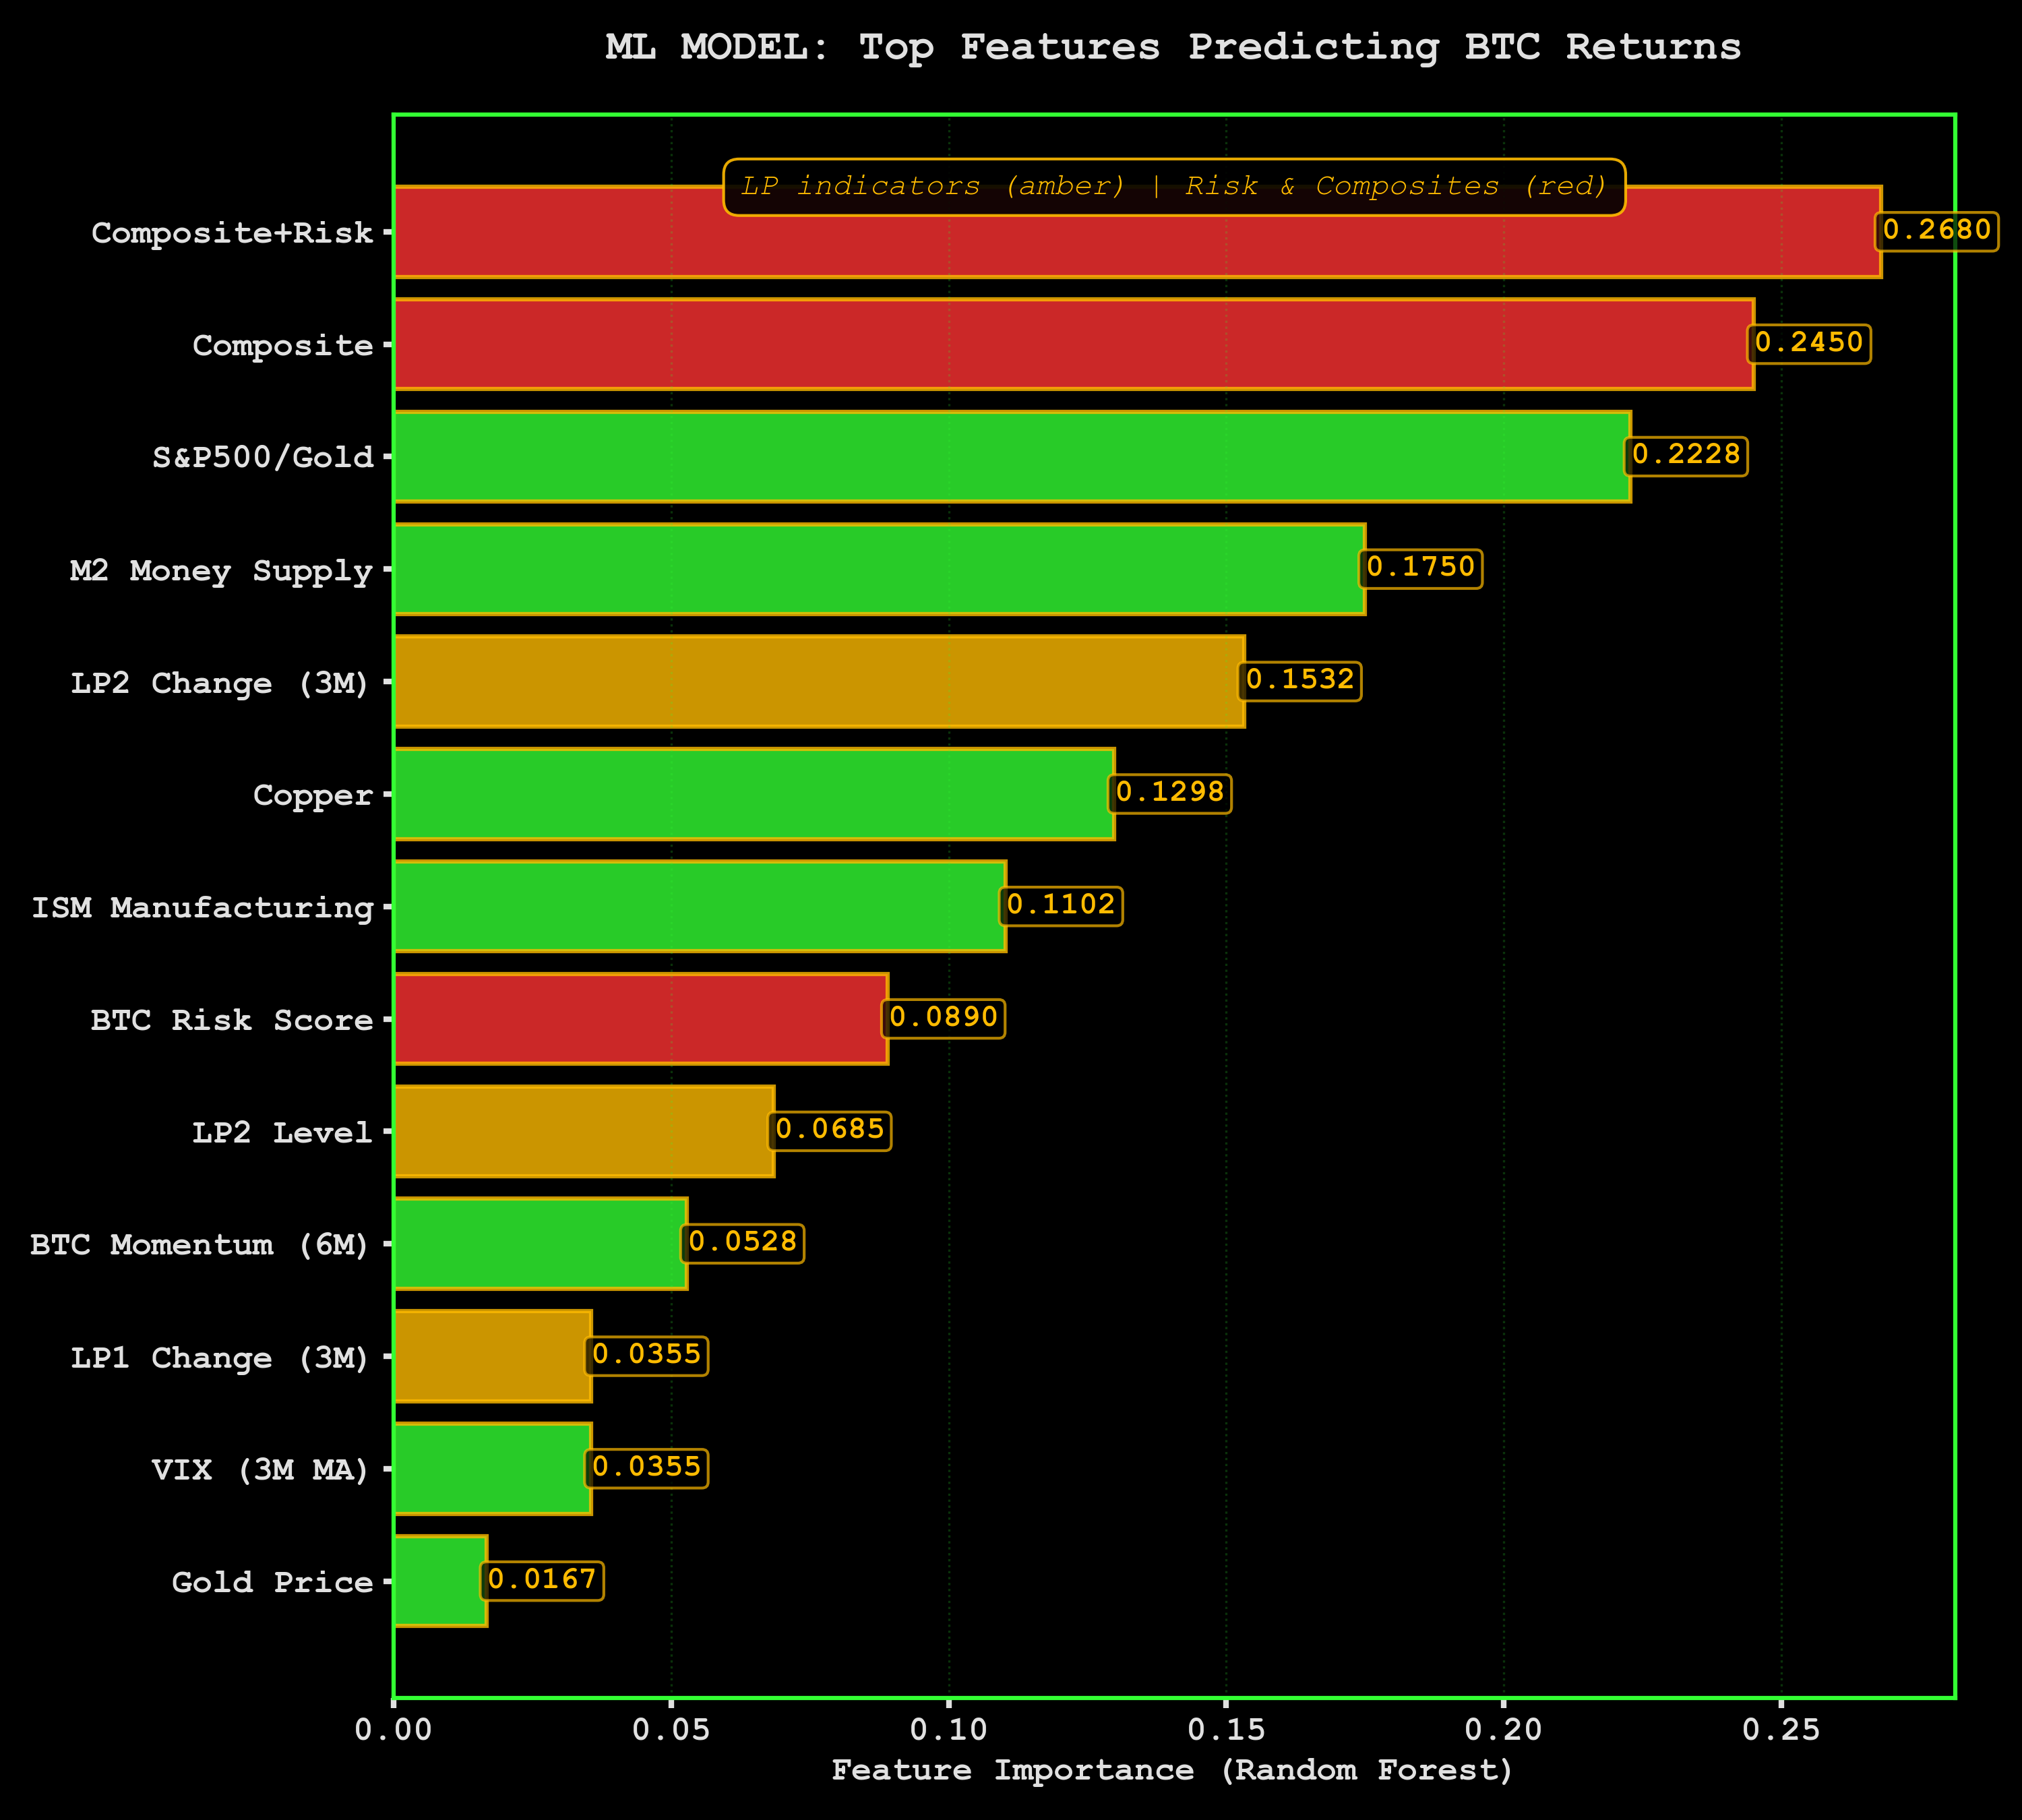
What This Chart Shows: ML model analyzed 5 years without bias. LP_Composite + LP_Composite_Risk = top predictors. Not cherry-picked. Not hand-selected because they fit my thesis. Machine tested 18 indicators—M2, credit spreads, repo, DXY, VIX, yields, RSI, momentum, volatility, the whole arsenal—and said "these two do the heavy lifting." When LP_Composite positive + BTC_Risk_Score low (now), 65-75% chance positive returns. That's not opinion. That's feature importance ranked by predictive power.
Machine doesn't have hopium. Just history. It doesn't care if you're tired. It doesn't care if this "feels" like 2022 or 2019 or 2015. It cares about what configuration of inputs historically precedes positive BTC returns. This setup pays 62-72% of the time. That's the edge. That's what systematic traders live on.
The Edge: 72% win rate = probability distribution, not guarantee. Run this trade 100 times historically → win 72, lose 28. Math works in your favor over iterations. Wall Street doesn't trade certainty. They trade edge. A 60% probability trade with 2:1 R:R crushes markets long-term. We've got 70%+ probability with multi-bagger upside. You don't need to be right every time. You need to be right more than you're wrong, sized correctly.
If Bull Case Hits:
- 3M: BTC $120k-$160k (educated guess, not prophecy)
- 12M: BTC $140k-$220k (wide range, long horizons uncertain)
- Probability: 62-72% (horizon-dependent)
Not moon. Not Lambo. Not "generational wealth" hopium. Just systematic edge with asymmetric payoff. The kind of setup professional traders back up the truck for.
Why This Matters: Most crypto analysis = pattern-matching 3 data points. Most liquidity analysis = ex-post rationalization. Most risk models = built by people who never lost real money. They've never felt the margin call at 3AM. Never watched a "sure thing" implode. Never had to explain to their spouse why the rent money's gone. This is different. This is built by someone who's blown up, rebuilt, and learned to respect the market.
The Innovation: Combining real-time liquidity (fuel) + cycle position risk (speedometer). LP models track 18+ macro indicators (M2, credit, repo spreads, DXY, yields). BTC Risk Score measures power-law cycle position. Score <25 = accumulation (we're ~27/100). Score >75 = euphoria (sell). Combined = probabilistic framework. You're getting it for the price of reading this document and doing the work.
Current Setup: LP_Composite +0.32σ (expanding). LP_1mo +1.98σ (strong short-term). BTC_Risk_Score ~27/100 (accumulation zone). Combo historically → +28.8% / 70-75% win rate at 3M. This is the exact configuration that precedes explosive moves in the historical record. Not every time. Most of the time.
The Fear: "What if I'm wrong?" You're not fighting being wrong. You're fighting being right too early. There's a difference. Wrong = thesis breaks, fundamentals shift, plumbing fails. Right too early = thesis correct, timing off by weeks/months, you get shaken out before the move. That's why position sizing matters. Edge is real but not guarantee. It's a tilt. Casino has 52% edge on roulette—they built Vegas on 2%. We've got 20-40% edge.
The Glory: Not moon. Not certainty. Not "BTC to $1 million by Tuesday." Asymmetric payoff envelope (~4:1 midpoint on historical setup returns; not a traded stop/target — see sizing rules S-VII). Wrong: -20-30% (survivable if sized right). Right: +50-150% (life-changing if positioned correctly). You're not betting hope. You're betting plumbing. You're betting that liquidity flows matter more than sentiment and that cycle position predicts return distributions. The machine agrees. History agrees. The question is: do you have the discipline to trade the edge?
VII. Wisdom for the Climb
Lessons from someone who's made it up and fallen off before
"The mountain doesn't care if you're tired. It only cares if you keep climbing."
"The mountain doesn't care if you're tired."
It doesn't care if you need this trade to work. It doesn't care about your rent, your conviction, your four-year cycle narrative. It moves on liquidity, not on your feelings.
The market will do what the market does. Your job is to position yourself to survive when it moves against you and profit when it moves for you. Respect the mountain.
"Pack light."
Position sizing is the only risk management that actually works. All the analysis in the world won't save you if you're sized wrong.
The math:
- If you can't survive a 30% drawdown without panic-selling, you're too heavy
- Size for the 28-38% cliff, not the 62-72% summit
- The goal is to stay in the game, not to maximize one trade
Livermore went broke multiple times. Not because he was wrong about direction. Because he was wrong about size.
"The crowd turns back at the steepest part."
When everyone agrees, the trade is over.
Right now, everyone agrees it's scary. Michigan Sentiment at 53.6, near 2008 levels. Fear Index at 16. Everyone agrees we should be worried.
Note that.
The steepest part of the climb is where most people quit. That's also where the summit gets closest.
"Being early feels like being lost."
The liquidity models turned positive. That doesn't mean you summit tomorrow. It means the path exists.
The hardest part of trading isn't being wrong. It's being right but early. Watching the position go against you while the thesis remains intact. Every voice in your head screaming "you were wrong" when you weren't. You were just early.
Patience isn't passive. It's the hardest form of action.
"An edge is not a bridge."
62-72% probability means losing 28-38% of the time. That's not a rounding error. That's real money. Real trades where the setup was perfect and the outcome was loss.
The edge doesn't guarantee any single trade. It compounds over many trades. The mountain doesn't owe you the summit just because you read the map correctly.
"The view from the top doesn't erase the climb."
Even if glory comes, even if BTC hits $150k, even if the divergence resolves exactly as the models predict, you'll still remember the exhaustion. The doubt. The 3AM sessions staring at charts that contradicted each other.
That's not a bug. That's the cost of admission.
The climb is supposed to be hard. That's why the view from the top means something.
VIII. The Choice
Rebellion against hopium, doom, and the crowd

"The choice isn't between certainty and doubt. It's between paralysis and edge."
I'm not bullish.
I'm not bearish.
I'm probabilistic.
Against the four-year cycle hopium that ignores regime change, that pretends 2024 must rhyme with 2020 and 2016, that treats the halving like a magic spell instead of one variable among many.
Against the "it's all over" doom that ignores historical patterns, that sees every drawdown as the end of crypto, that capitulates at exactly the wrong time because sentiment feels like information.
Against the crowd that's always loudest at turns. Bullish at tops, bearish at bottoms, confident precisely when they should be uncertain.
The rebellion is intellectual honesty. The rebellion is saying "I don't know for sure" while still being willing to act on probability. The rebellion is respecting both the edge and the uncertainty.
The Framework
If you decide to climb:
-
Buy, but don't bet the farm. Position size for the 28-38% bear case, not the 62-72% bull case. This isn't about getting rich on one trade. It's about staying in the game long enough to compound edges.
-
Have your exits ready. Know your invalidation triggers before you enter:
- LP_Composite drops below -0.5σ (liquidity reversal)
- LP_1mo turns negative (short-term signal breaks)
- BTC Risk Score rises above 75/100 (euphoria zone - time to scale out)
- Combined signal deteriorates (liquidity negative AND risk elevated = bad setup)
- Stimulus officially canceled
- Fed starts hiking cycle
-
Take profits on the way up. Glory isn't a single price point. It's a range. Scale out. Don't get greedy. The LP+Risk models will tell you when we're entering late-cycle euphoria (risk score >75). That's when you sell, not when CNBC is screaming "$500k BTC."
-
Respect the timeline. Use Composite for 1M and 3M horizons. Use LP_12mo for 12M. Don't expect 12-month returns in 1 month. The 3-month model says 70% win rate for +28.8% average returns. That's your realistic base case. Not moon. Not Lambo. Math.
May the odds be ever in your favor.
They are. 62-72% in your favor.
But not 100%.
Never 100%.
IX. The Close
Return to 3AM
"At 3AM you realize: the climb and the fall are the same mountain. You were always here."
The hills are there. I can't move them.
The factories are closing. The cash-only Friday night economy dried up. Credit cards maxed out. Real wages stagnant. Everyone you know is one bad month from broke. The consumer sentiment surveys read like suicide notes. Manufacturing surveys scream recession. Every legacy indicator pointing straight down.
The old economy bleeding out while the new one runs on money that doesn't exist yet.
Every piece of visible data screaming SELL.
But liquidity doesn't read the news. The plumbing's turning back on while everyone's watching the rear-view mirror confirm a recession that the money already priced in half a year ago. The Fed's balance sheet expanding. Repo markets unfreezing. M2 growing. The wholesale funding machine humming back to life in the dark where nobody's looking.
The machine doesn't lie about probability. Seven out of ten times this setup appears, Bitcoin's higher three months later. Not because sentiment improved. Because the monetary spigot opened and nobody noticed until it was too late.
That's the setup. Bad vibes. Bad data. Good liquidity.
The divergence between what you see on the street (collapse) and what you see in the plumbing (expansion). Between what the cash-only vices tell you about consumer confidence and what the repo markets tell you about capital flows. Between what everyone feels and what the money actually does.
Glory isn't guaranteed. One in three times, the cliff crumbles. The bear case is real. Maybe fiscal stimulus dies. Maybe liquidity reverses. Maybe the four-year cycle really is dead this time.
But the conditions for glory exist. Right now. While everyone's exhausted. The only question is whether you still have legs for the climb.
If you're reading this at 3AM, staring at charts that contradict each other, wondering if you've lost your edge or just your mind—you're not alone. That exhaustion is signal, not noise. Capitulation is a feeling before it's a price.
The water holds you up if you stop fighting it. Even when you can't see the shore. Even when you can't see over the hills. The fear you feel? It's not weakness. It's the same fear that marks every turning point. The voice that screams "too early" when you're actually just early. The doubt that feels like information but is just exhaustion dressed up as wisdom.
I know you're tired. But glory is just over those hills. And the odds say it's closer than you think.
We were somewhere around the $86k level when the fear began to take hold.
The cash-only Friday night economy was dead. The factories were dying. The consumer sentiment surveys read like suicide notes. Every legacy indicator screaming SELL while the liquidity machine hummed back to life in the dark where nobody was watching.
And somewhere in that gap—between what everyone could see and what the money was doing—fortunes were being made by people savage enough to act while everyone else was paralyzed by the obvious.
This is the trade that makes your hands shake at 3AM. Not because you don't trust the data. Because you do trust it, and it's telling you to buy when every instinct screams SELL. That's the edge. The ability to act when paralyzed feels like wisdom and courage feels like suicide.
X. The Builders
Standing on the shoulders of those who shared their knowledge

"You were never alone in this. The pattern already knew."
This analysis benefits from the generous contributions of the crypto research community:
@maths (TradingView) — Bitcoin Core Risk Model Pine Script. The foundational risk model combining log regression, MVRV Z-score, and momentum components.
@Simba🌾Farmsent — RICK/GOLD ratio concept. The insight that strip club spending can serve as a contrarian indicator for consumer confidence. Yes, really.
@Bumbu — Ongoing support and feedback that shaped the structure and tone of this analysis.
Thank you for making this work possible.
XI. The Map & The Compass
The instruments that guide when visibility drops to zero
"Every direction is the same direction when you're falling through eight kinds of dark."
Michigan Consumer Sentiment Index: University of Michigan Surveys of Consumers (FRED: UMCSENT)
Liquidity Pulse Models: Custom composites tracking:
- M2 Money Supply (Federal Reserve)
- Reverse Repo Facility usage (NY Fed)
- SOFR-EFFR Spread (Federal Reserve)
- Commercial Bank Credit (Federal Reserve)
Model Definitions:
- LP_1mo: 30-day forward optimization
- LP_3mo: 90-day forward optimization (Granger F~9.8)
- LP_12mo: 360-day forward optimization
- LP_Composite: Weighted blend (50% 1mo + 30% 3mo + 20% 12mo)
Bitcoin Risk Model: Proprietary model combining:
- Log regression trendlines (power law adoption curve)
- Market Cap Z-Score (Glassnode: BTCMC vs BTCMCR)
- 14-period RSI (momentum component)
Market Stress Indicators:
- VIX: CBOE Volatility Index
- SOFR-EFFR Spread: Modern TED spread replacement
- Credit Spreads: ICE BofA BBB Corporate Index
Fear & Greed Index: CNN Markets (https://edition.cnn.com/markets/fear-and-greed)
S&P/Gold Ratio: ES1!/GOLD (S&P 500 futures to gold spot)
BTC Dominance: BTC Market Cap / Total Crypto Market Cap
ISM Manufacturing PMI: Institute for Supply Management (USBCOI)
Business Loans: Federal Reserve H.8 data (BUSLOANS)
Data as of: Nov 25, 2025
XII. The Terms of Engagement
Every climb requires understanding the risks before you rope in
"The snake watches itself eating its tail and realizes: I am the risk. I am the warning. I am the one who climbs."
The Ouroboros Principle
The snake eating its tail isn't just ancient symbolism—it's a trading truth. You are both the opportunity and the risk. The same person who identifies the edge can sabotage the execution. The same conviction that builds position can turn to panic that sells the bottom.
Every warning in this document applies to the author too. These aren't disclaimers meant for lawyers. They're guardrails meant for humans—specifically, the human who wrote this at 3AM after staring at too many charts.
The edge is real. 88.9% win rate (n=18, 95% CI 67-97%), asymmetric payoff envelope, documented across 18 setups. But the edge doesn't trade itself. You do. And you come with biases, fears, hopes, and 3AM decision-making capacity that no model can account for.
The ouroboros completes its cycle. So do markets. The question isn't whether the cycle will turn—it's whether you'll still be positioned when it does.
The Contract With Yourself
Before you act on anything in this document, answer these questions honestly:
- Can I afford to lose this capital entirely? If the answer involves rent, food, or obligations—you're not ready.
- Do I understand the model well enough to trust it when it conflicts with my emotions? Edge requires conviction during drawdowns.
- Have I defined my exit criteria before entering? The time to plan your retreat is before the battle, not during.
- Am I sized appropriately for the volatility? A 30% drawdown on a 5% position is different than on a 50% position.
This analysis provides probability. You provide the discipline.
The Final Word
Eighty-eight point nine percent is not one hundred percent. Five-to-one reward-to-risk is not guaranteed profit. The mountain doesn't owe you the summit just because you packed the right gear.
But the conditions exist. The liquidity is turning. The risk models are green. The machine has spoken its probability.
What you do next is your choice. Choose deliberately.
Rebel Terminal Research Nov 25, 2025 | 3:33 AM Somewhere between exhaustion and clarity
APPENDIX — REPRODUCIBILITY (AS PRINTED 2025-11-25)
Transcribed from the article body — not recomputed. No LP producer feed exists; the Setup Monitor above shows what is live.
| MODEL | HORIZON | PRINTED | DEFINITION |
|---|---|---|---|
| LP_1mo | 30-day forward | +1.98σ | 1-month lead liquidity pulse |
| LP_3mo | 90-day forward | -1.29σ | 3-month lead (Granger F~9.8) |
| LP_12mo | 360-day forward | -1.20σ | 12-month lead |
| LP_Composite | 12M blend | +0.32σ | 50% 1mo + 30% 3mo + 20% 12mo |
| LP 1mo+Risk | 30-day | +1.98σ | short-term signal w/ risk filter |
| LP 3mo+Risk | 90-day | -1.16σ | medium-term w/ risk filter |
| LP 12mo+Risk | 360-day | -1.15σ | long-term w/ risk filter |
| LP Composite+Risk | 12M | -0.53σ | up from -13.5 trough |
| BTC Risk Score | cycle position | ~27/100 | accumulation zone (<50 = early) |
| Setup 3M | forward 3M | 88.9% (n=18) | 16W/2L, 95% CI 67-97% |